SOM cluster: 418
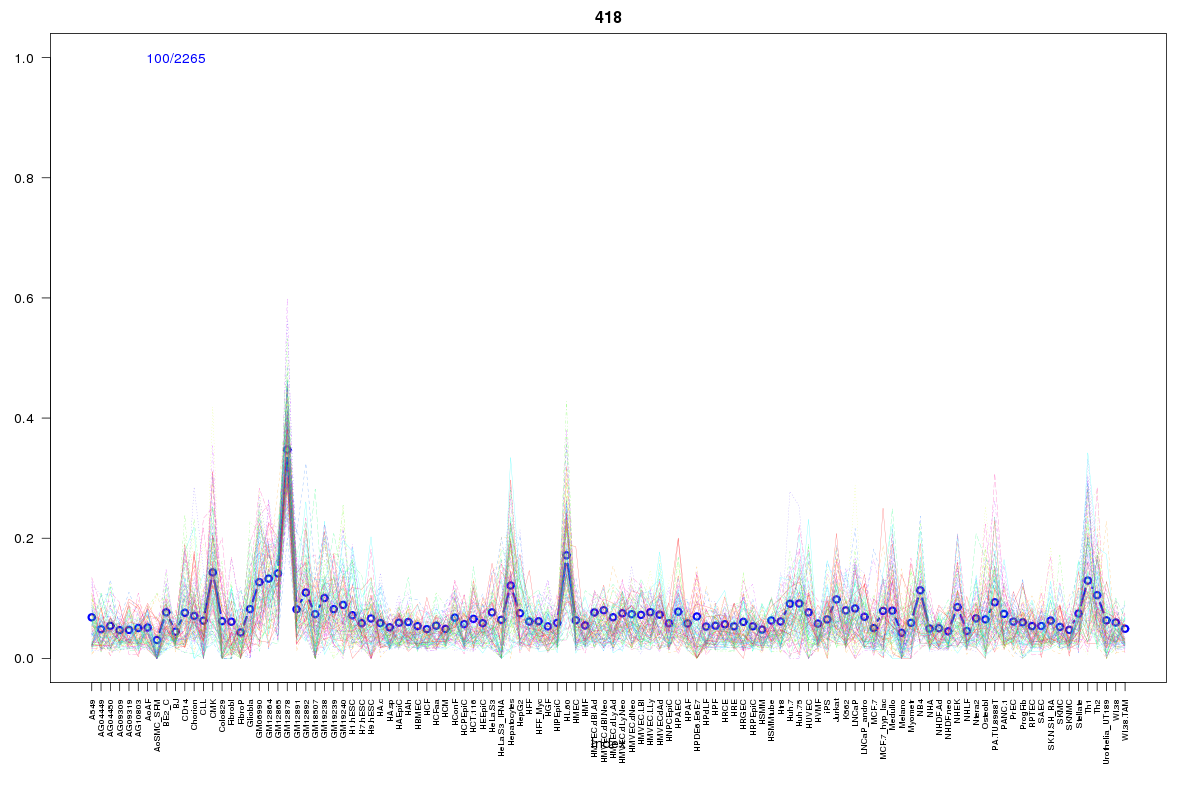
Cluster Hypersensitivity Profile

Genomic Location Trend
These plots show the distribution of the DHS sites surrounding the Transcript Start Site of the nearest gene.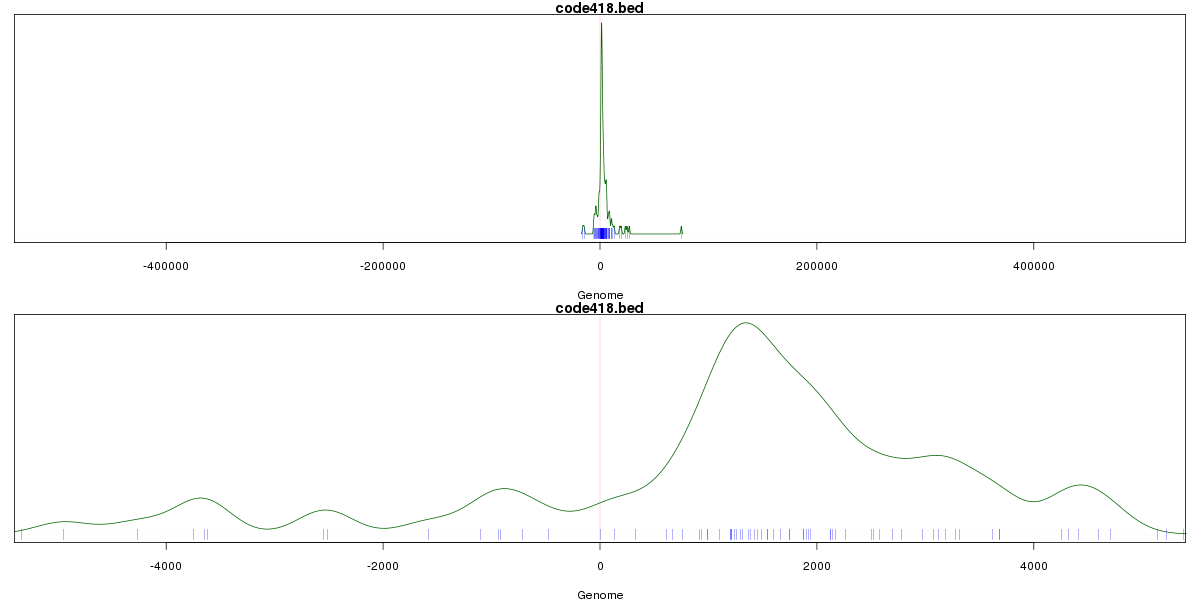
Stats
Number of sites: 2265Promoter: 10%
CpG-Island: 2%
Conserved: 22%
Enriched Motifs & Matches
Match Detail: [Jaspar]
|
| ||
|---|---|---|
| Sites: 41/100 | e-val: 6.3e-18 | ||
| Factor | e-val(match) | DB |
| SP1 | 0.000000036276 | JASPAR |
| Pax4 | 0.0000008089 | JASPAR |
| Klf4 | 0.000034841 | JASPAR |
| RREB1 | 0.00010001 | JASPAR |
| PPARG::RXRA | 0.00026396 | JASPAR |
|
| ||
| Sites: 25/100 | e-val: 0.0028 | ||
| Factor | e-val(match) | DB |
| EWSR1-FLI1 | 0.00000010296 | JASPAR |
| SPI1 | 0.0092238 | JASPAR |
| SPIB | 0.013079 | JASPAR |
| SP1 | 0.014241 | JASPAR |
| Spz1 | 0.025687 | JASPAR |
|
| ||
| Sites: 14/100 | e-val: 2.4 | ||
| Factor | e-val(match) | DB |
| ESR1 | 0.00000000064268 | JASPAR |
| ESR2 | 0.0000000046148 | JASPAR |
| PPARG | 0.000016533 | JASPAR |
| NR4A2 | 0.000053795 | JASPAR |
| RREB1 | 0.0010876 | JASPAR |
BED file downloads
Top 10 Example Regions
| Location | Gene Link | Dist. |
|---|---|---|
| chr1: 150460320-150460470 | ADAMTSL4 | 12.97 |
| chr22: 39922265-39922415 | RP5-1104E15.6 | 35.24 |
| chr17: 18085920-18086070 | TOP3A | 36.03 |
| chr8: 6567180-6567330 | CTD-2541M15.1 | 40.41 |
| chr19: 10477920-10478070 | ICAM3 | 41.29 |
| chr19: 10477920-10478070 | TYK2 | 41.29 |
| chr19: 10477920-10478070 | RAVER1 | 41.29 |
| chr12: 120636220-120636370 | GCN1L1 | 41.53 |
| chr12: 111126425-111126575 | HVCN1 | 42.88 |
| chr12: 111126425-111126575 | TCTN1 | 42.88 |