SOM cluster: 424
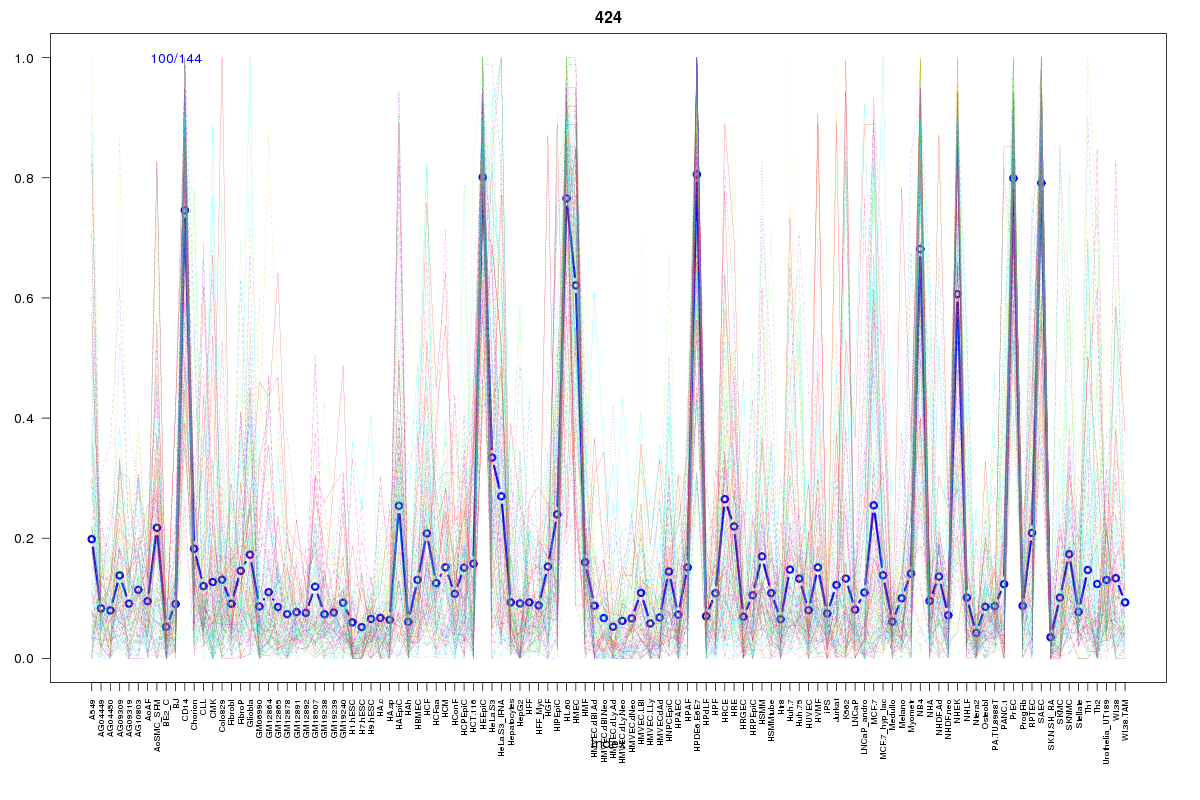
Cluster Hypersensitivity Profile

Genomic Location Trend
These plots show the distribution of the DHS sites surrounding the Transcript Start Site of the nearest gene.
Stats
Number of sites: 144Promoter: 9%
CpG-Island: 0%
Conserved: 40%
Enriched Motifs & Matches
Match Detail: [Jaspar]
|
| ||
|---|---|---|
| Sites: 32/100 | e-val: 0.27 | ||
| Factor | e-val(match) | DB |
| Pou5f1 | 0.00000000025951 | JASPAR |
| Sox2 | 0.00000000029452 | JASPAR |
| HLF | 0.00000021128 | JASPAR |
| NFIL3 | 0.0000019171 | JASPAR |
| CEBPA | 0.000013582 | JASPAR |
BED file downloads
Top 10 Example Regions
| Location | Gene Link | Dist. |
|---|---|---|
| chr4: 100777440-100777590 | LAMTOR3 | 53.65 |
| chr6: 15063780-15063930 | RP1-190J20.2 | 56.16 |
| chr3: 122043840-122043990 | CSTA | 61.98 |
| chr8: 75059080-75059230 | JPH1 | 64.55 |
| chr19: 18364640-18364790 | PDE4C | 65.78 |
| chr19: 18364640-18364790 | PGPEP1 | 65.78 |
| chr19: 18364640-18364790 | IFI30 | 65.78 |
| chr4: 1294900-1295050 | CTBP1-AS2 | 66.38 |
| chr4: 1294900-1295050 | AC078852.2 | 66.38 |
| chr3: 152928600-152928750 | RAP2B | 67.1 |