SOM cluster: 431
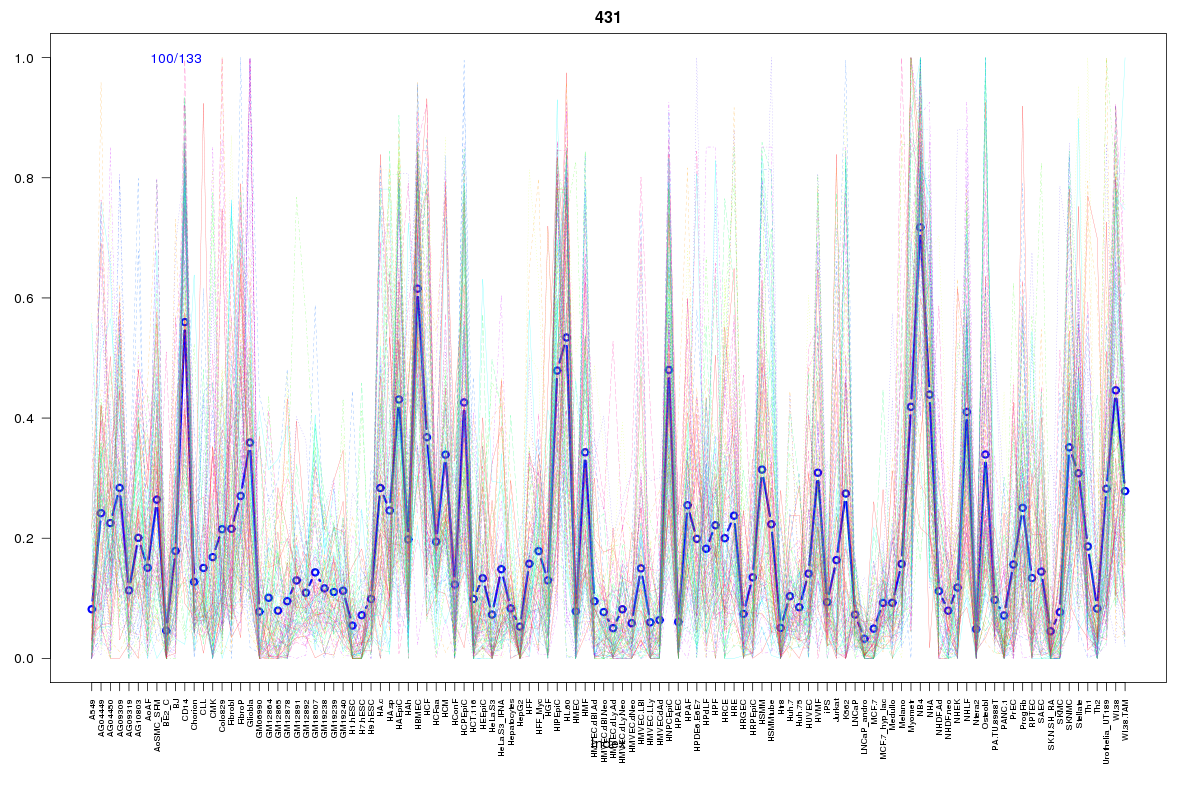
Cluster Hypersensitivity Profile

Genomic Location Trend
These plots show the distribution of the DHS sites surrounding the Transcript Start Site of the nearest gene.
Stats
Number of sites: 133Promoter: 1%
CpG-Island: 1%
Conserved: 29%
Enriched Motifs & Matches
Match Detail: [Jaspar]
|
| ||
|---|---|---|
| Sites: 32/100 | e-val: 0.00000028 | ||
| Factor | e-val(match) | DB |
| RUNX1 | 0.000000033585 | JASPAR |
| RREB1 | 0.00065834 | JASPAR |
| ZNF354C | 0.0024595 | JASPAR |
| MYC::MAX | 0.0051643 | JASPAR |
| Tcfcp2l1 | 0.011409 | JASPAR |
|
| ||
| Sites: 27/100 | e-val: 0.34 | ||
| Factor | e-val(match) | DB |
| NFE2L2 | 0.00000000041729 | JASPAR |
| AP1 | 0.000000021917 | JASPAR |
| NFE2L1::MafG | 0.017638 | JASPAR |
| Pdx1 | 0.0249 | JASPAR |
| HOXA5 | 0.034158 | JASPAR |
BED file downloads
Top 10 Example Regions
| Location | Gene Link | Dist. |
|---|---|---|
| chrX: 9875720-9875870 | SHROOM2 | 53.85 |
| chr3: 9954160-9954310 | EMC3 | 57.74 |
| chr9: 115950620-115950770 | FAM225A | 59.4 |
| chr9: 115950620-115950770 | FKBP15 | 59.4 |
| chr9: 115950620-115950770 | FAM225B | 59.4 |
| chr12: 108954120-108954270 | FICD | 62.07 |
| chr16: 66559840-66559990 | CMTM2 | 65.54 |
| chr19: 52255080-52255230 | HAS1 | 66.46 |
| chr19: 52255080-52255230 | FPR1 | 66.46 |
| chr19: 52255080-52255230 | snoU13 | 66.46 |