SOM cluster: 463
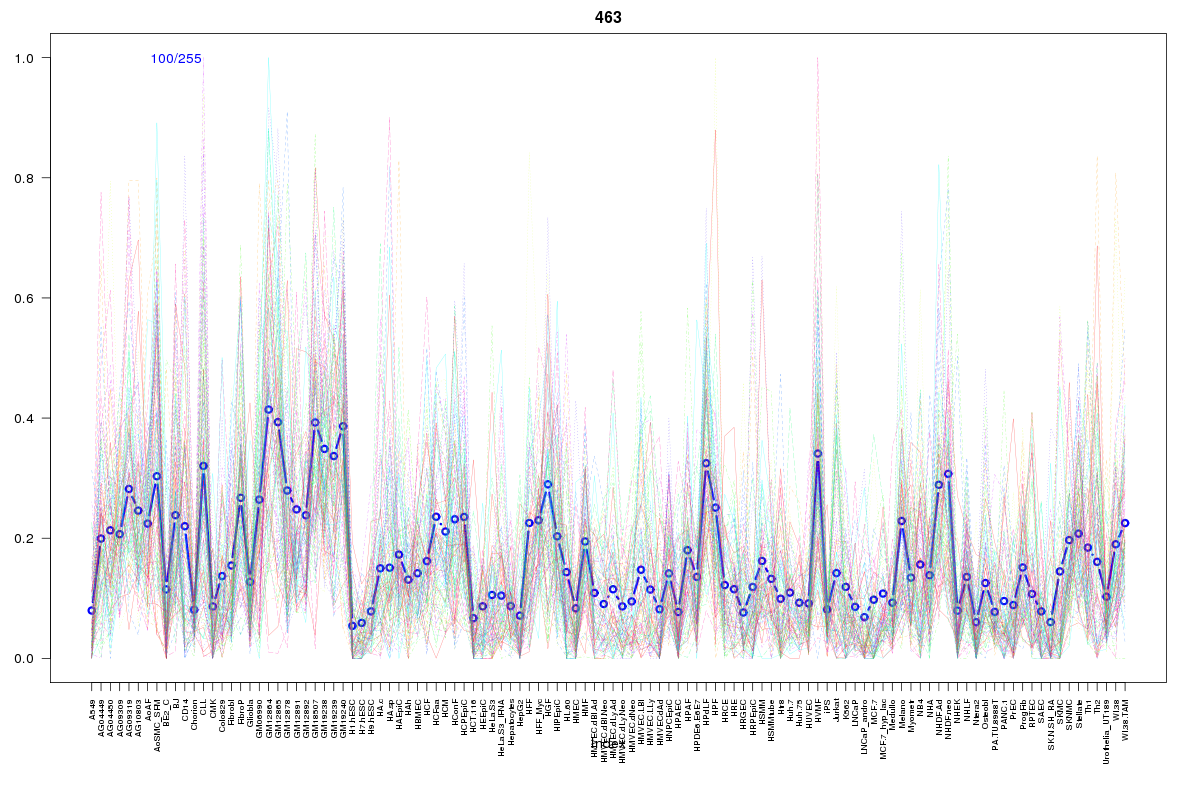
Cluster Hypersensitivity Profile

Genomic Location Trend
These plots show the distribution of the DHS sites surrounding the Transcript Start Site of the nearest gene.
Stats
Number of sites: 255Promoter: 9%
CpG-Island: 1%
Conserved: 29%
Enriched Motifs & Matches
Match Detail: [Jaspar]
|
| ||
|---|---|---|
| Sites: 29/100 | e-val: 1.5e-17 | ||
| Factor | e-val(match) | DB |
| IRF1 | 0.000000001791 | JASPAR |
| IRF2 | 0.000000363 | JASPAR |
| FOXA1 | 0.01281 | JASPAR |
| NR1H2::RXRA | 0.022587 | JASPAR |
| NFATC2 | 0.024144 | JASPAR |
BED file downloads
Top 10 Example Regions
| Location | Gene Link | Dist. |
|---|---|---|
| chr1: 171579620-171579770 | PFN1P1 | 49.66 |
| chr17: 27876300-27876450 | GIT1 | 49.77 |
| chr17: 27876300-27876450 | ANKRD13B | 49.77 |
| chr2: 71292080-71292230 | OR7E62P | 51.3 |
| chr2: 71292080-71292230 | MCEE | 51.3 |
| chr4: 47841340-47841490 | CORIN | 52.06 |
| chr8: 11337560-11337710 | FAM167A | 52.21 |
| chr8: 11337560-11337710 | RP11-148O21.3 | 52.21 |
| chr9: 130835060-130835210 | LCN2 | 55.15 |
| chr17: 47818460-47818610 | RP11-613C6.2 | 59.37 |