SOM cluster: 550
Cluster Hypersensitivity Profile

Genomic Location Trend
These plots show the distribution of the DHS sites surrounding the Transcript Start Site of the nearest gene.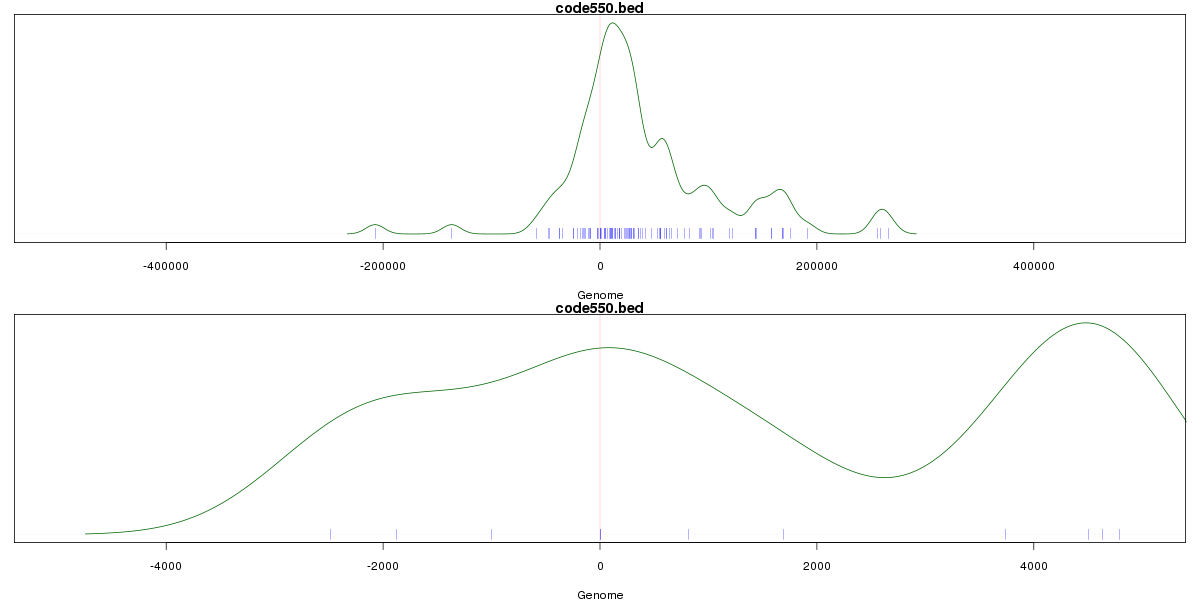
Stats
Number of sites: 183Promoter: 5%
CpG-Island: 0%
Conserved: 80%
Enriched Motifs & Matches
Match Detail: [Jaspar]
|
| ||
|---|---|---|
| Sites: 52/100 | e-val: 2.6e-36 | ||
| Factor | e-val(match) | DB |
| AP1 | 0.000000000061833 | JASPAR |
| NFE2L2 | 0.000000007296 | JASPAR |
| PPARG | 0.0029588 | JASPAR |
| NFE2L1::MafG | 0.0043502 | JASPAR |
| PBX1 | 0.011549 | JASPAR |
|
| ||
| Sites: 56/100 | e-val: 9.7e-29 | ||
| Factor | e-val(match) | DB |
| TLX1::NFIC | 0.00000000000022216 | JASPAR |
| EWSR1-FLI1 | 0.00096708 | JASPAR |
| NFIC | 0.0079859 | JASPAR |
| znf143 | 0.0086541 | JASPAR |
| INSM1 | 0.022335 | JASPAR |
BED file downloads
Top 10 Example Regions
| Location | Gene Link | Dist. |
|---|---|---|
| chr11: 111606580-111606730 | SIK2 | 38.69 |
| chr11: 111606580-111606730 | AP000925.2 | 38.69 |
| chr11: 111606580-111606730 | PPP2R1B | 38.69 |
| chr8: 8932520-8932670 | RP11-10A14.4 | 44.85 |
| chr16: 14580525-14580675 | PARN | 47.75 |
| chr3: 136062780-136062930 | PCCB | 51.3 |
| chr19: 11455140-11455290 | SWSAP1 | 58.17 |
| chr19: 11455140-11455290 | DKFZP761J1410 | 58.17 |
| chr19: 11455140-11455290 | PRKCSH | 58.17 |
| chr9: 110267240-110267390 | KLF4 | 59.43 |