SOM cluster: 56
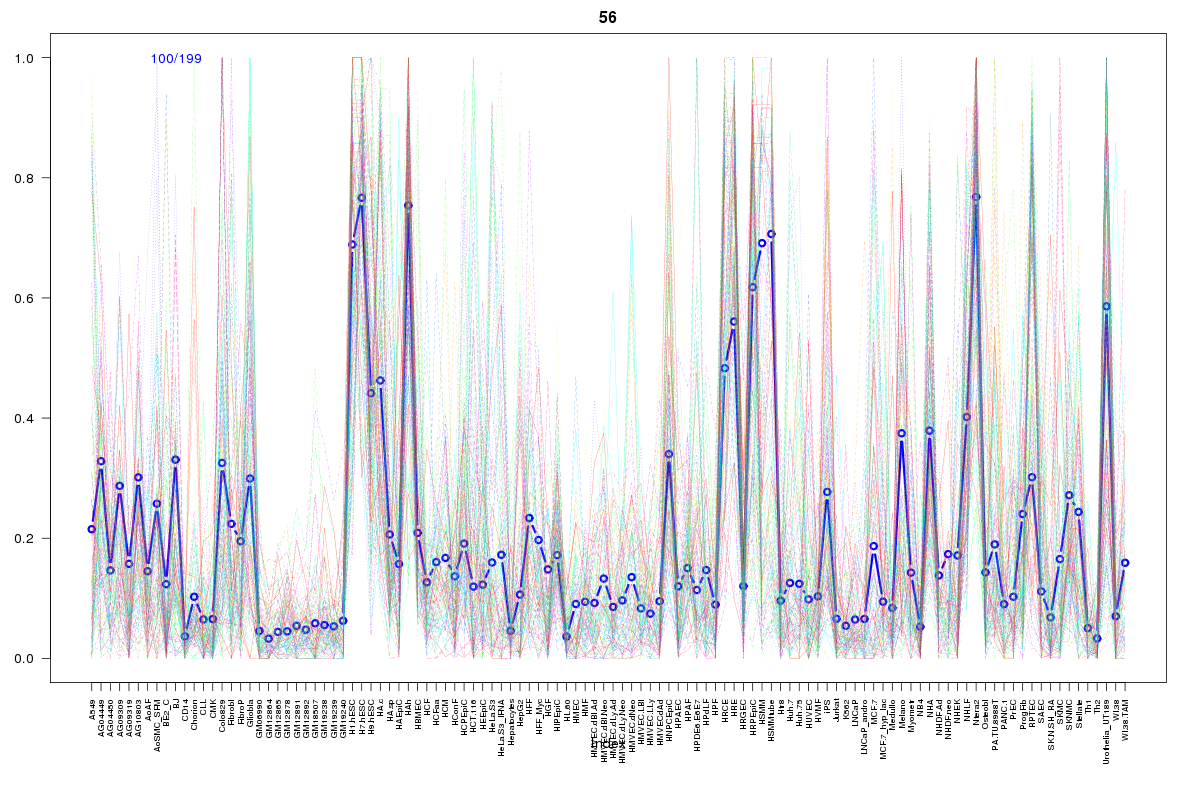
Cluster Hypersensitivity Profile

Genomic Location Trend
These plots show the distribution of the DHS sites surrounding the Transcript Start Site of the nearest gene.
Stats
Number of sites: 199Promoter: 6%
CpG-Island: 1%
Conserved: 48%
Enriched Motifs & Matches
Match Detail: [Jaspar]
|
| ||
|---|---|---|
| Sites: 24/100 | e-val: 0.000000000000013 | ||
| Factor | e-val(match) | DB |
| Stat3 | 0.0000052645 | JASPAR |
| TEAD1 | 0.000023128 | JASPAR |
| NF-kappaB | 0.000052362 | JASPAR |
| RELA | 0.000057041 | JASPAR |
| REL | 0.00018821 | JASPAR |
|
| ||
| Sites: 23/100 | e-val: 0.0023 | ||
| Factor | e-val(match) | DB |
| Pax4 | 0.0000000027721 | JASPAR |
| SP1 | 0.000025505 | JASPAR |
| RREB1 | 0.00022002 | JASPAR |
| ZNF354C | 0.00062628 | JASPAR |
| T | 0.0019934 | JASPAR |
BED file downloads
Top 10 Example Regions
| Location | Gene Link | Dist. |
|---|---|---|
| chr3: 125899720-125899870 | ALDH1L1 | 49.11 |
| chr11: 20044340-20044490 | NAV2 | 51.98 |
| chr11: 20044340-20044490 | NAV2-AS2 | 51.98 |
| chr13: 61989280-61989430 | PCDH20 | 52.13 |
| chr1: 164572060-164572210 | PBX1 | 53.72 |
| chr1: 164572060-164572210 | RNU6-171P | 53.72 |
| chr1: 180892360-180892510 | XPR1 | 54.27 |
| chr13: 39261040-39261190 | FREM2 | 60.64 |
| chr8: 127461800-127461950 | RP11-103H7.2 | 63.74 |
| chr6: 127839980-127840130 | SOGA3 | 66.59 |