SOM cluster: 573
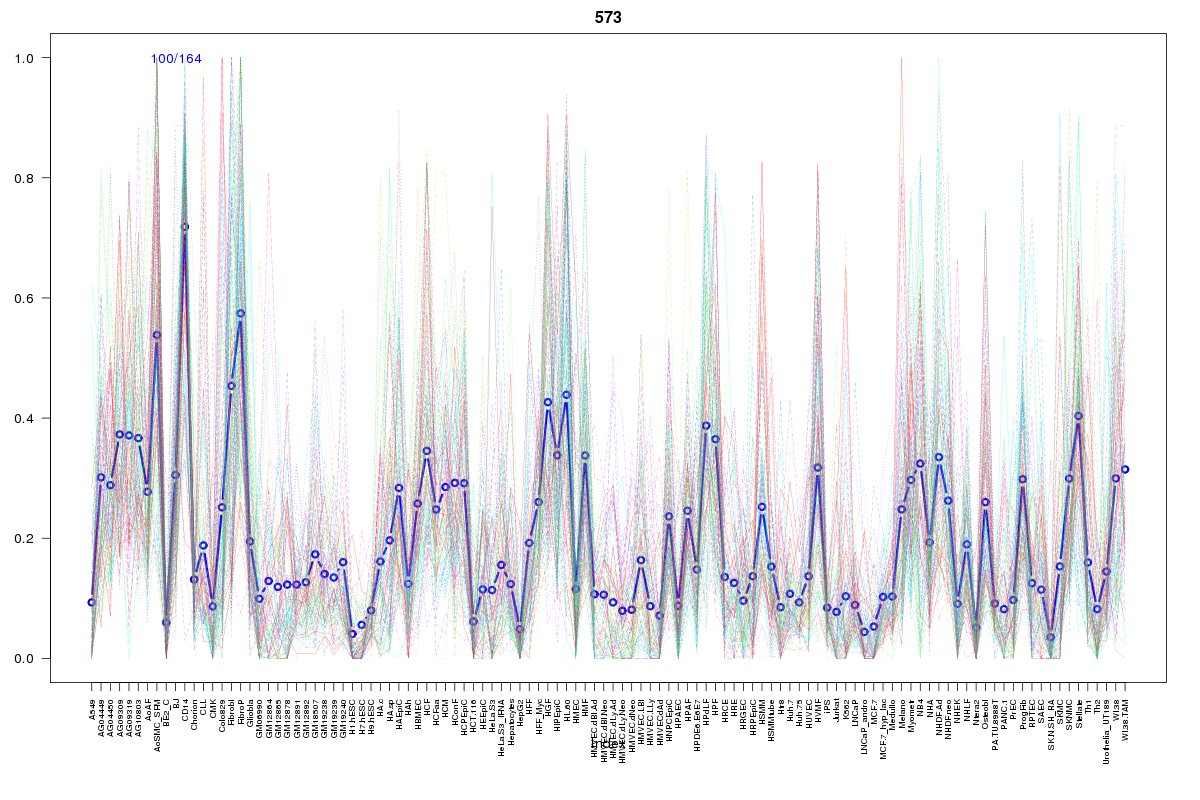
Cluster Hypersensitivity Profile

Genomic Location Trend
These plots show the distribution of the DHS sites surrounding the Transcript Start Site of the nearest gene.
Stats
Number of sites: 164Promoter: 7%
CpG-Island: 0%
Conserved: 44%
Enriched Motifs & Matches
Match Detail: [Jaspar]
|
| ||
|---|---|---|
| Sites: 30/100 | e-val: 0.0022 | ||
| Factor | e-val(match) | DB |
| Foxd3 | 0.0051618 | JASPAR |
| Foxq1 | 0.0066693 | JASPAR |
| Lhx3 | 0.0074509 | JASPAR |
| IRF1 | 0.020591 | JASPAR |
| Nkx2-5 | 0.022529 | JASPAR |
BED file downloads
Top 10 Example Regions
| Location | Gene Link | Dist. |
|---|---|---|
| chr9: 130595980-130596130 | ENG | 36.87 |
| chr8: 42775280-42775430 | THAP1 | 47.23 |
| chr8: 42775280-42775430 | HOOK3 | 47.23 |
| chr1: 153957760-153957910 | RAB13 | 47.94 |
| chr1: 153957760-153957910 | NUP210L | 47.94 |
| chr1: 153957760-153957910 | CREB3L4 | 47.94 |
| chr16: 90098565-90098715 | AFG3L1P | 51.62 |
| chr4: 39715480-39715630 | SMIM14 | 59.37 |
| chr12: 6658160-6658310 | NOP2 | 61.53 |
| chr12: 6658160-6658310 | CHD4 | 61.53 |