SOM cluster: 577
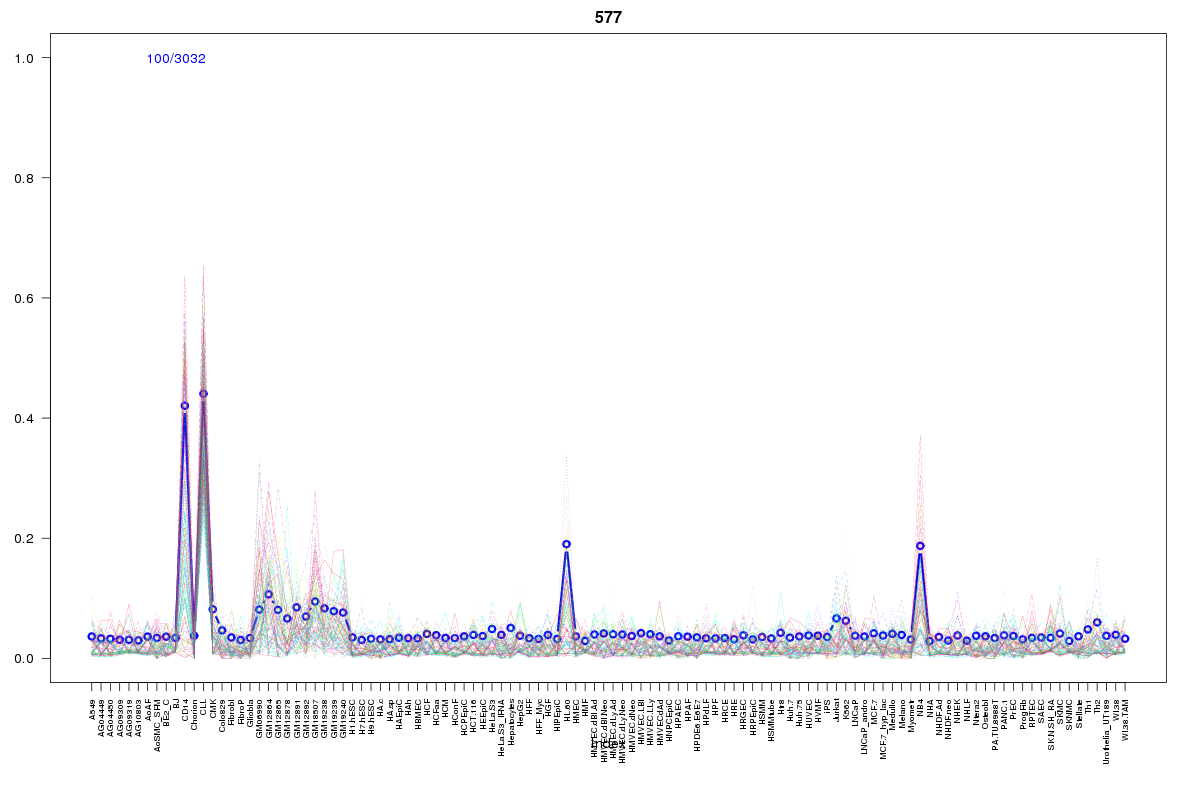
Cluster Hypersensitivity Profile

Genomic Location Trend
These plots show the distribution of the DHS sites surrounding the Transcript Start Site of the nearest gene.
Stats
Number of sites: 3032Promoter: 5%
CpG-Island: 0%
Conserved: 25%
Enriched Motifs & Matches
Match Detail: [Jaspar]
|
| ||
|---|---|---|
| Sites: 50/100 | e-val: 0 | ||
| Factor | e-val(match) | DB |
| SPI1 | 0.00000078024 | JASPAR |
| IRF1 | 0.0000050916 | JASPAR |
| SPIB | 0.000032329 | JASPAR |
| FEV | 0.00021622 | JASPAR |
| IRF2 | 0.00079669 | JASPAR |
BED file downloads
Top 10 Example Regions
| Location | Gene Link | Dist. |
|---|---|---|
| chr1: 146675780-146675930 | PRKAB2 | 13.02 |
| chr3: 31969445-31969595 | ZNF860 | 33.81 |
| chr8: 86176140-86176290 | RP11-219B4.3 | 36.08 |
| chr22: 36945240-36945390 | RP5-1119A7.11 | 39.32 |
| chr3: 128403920-128404070 | RPN1 | 39.68 |
| chr3: 128403920-128404070 | MARK2P8 | 39.68 |
| chr11: 17422465-17422615 | NUCB2 | 41.9 |
| chr11: 86135965-86136115 | C11orf73 | 42.99 |
| chr4: 102723280-102723430 | BANK1 | 43.86 |
| chr8: 53029680-53029830 | RP11-546K22.1 | 44.61 |