SOM cluster: 601
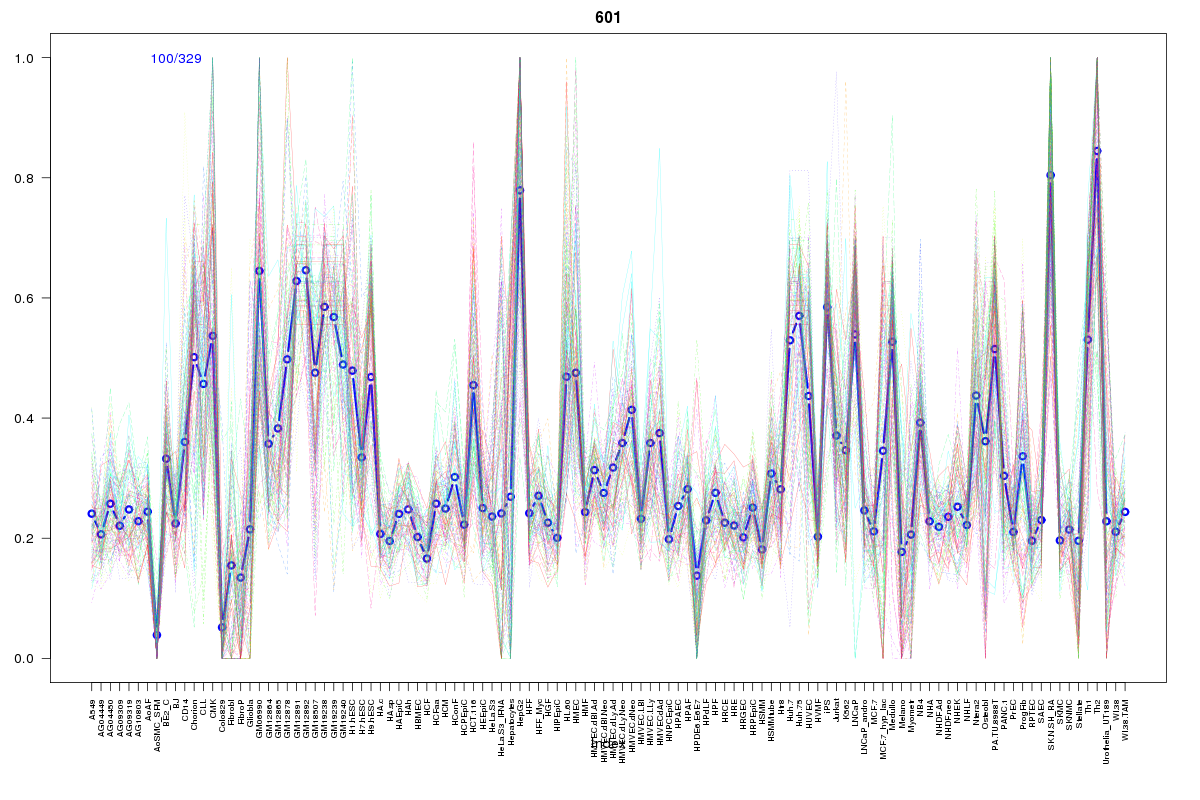
Cluster Hypersensitivity Profile

Genomic Location Trend
These plots show the distribution of the DHS sites surrounding the Transcript Start Site of the nearest gene.
Stats
Number of sites: 329Promoter: 41%
CpG-Island: 86%
Conserved: 63%
Enriched Motifs & Matches
Match Detail: [Jaspar]
|
| ||
|---|---|---|
| Sites: 91/100 | e-val: 0 | ||
| Factor | e-val(match) | DB |
| SP1 | 0.00000028988 | JASPAR |
| Egr1 | 0.00073052 | JASPAR |
| PLAG1 | 0.001719 | JASPAR |
| TFAP2A | 0.0027756 | JASPAR |
| Klf4 | 0.0032083 | JASPAR |
|
| ||
| Sites: 76/100 | e-val: 0 | ||
| Factor | e-val(match) | DB |
| SP1 | 0.00000008167 | JASPAR |
| TFAP2A | 0.00099537 | JASPAR |
| Klf4 | 0.0030625 | JASPAR |
| Egr1 | 0.012385 | JASPAR |
| PLAG1 | 0.026878 | JASPAR |
|
| ||
| Sites: 56/100 | e-val: 0.0011 | ||
| Factor | e-val(match) | DB |
| SP1 | 0.00042606 | JASPAR |
| Zfx | 0.00057238 | JASPAR |
| TFAP2A | 0.0041048 | JASPAR |
| Egr1 | 0.030308 | JASPAR |
| PLAG1 | 0.088414 | JASPAR |
BED file downloads
Top 10 Example Regions
| Location | Gene Link | Dist. |
|---|---|---|
| chr5: 175970120-175970270 | RNF44 | 39.76 |
| chr5: 175970120-175970270 | EIF4E1B | 39.76 |
| chr16: 89258780-89258930 | CDH15 | 45.45 |
| chr1: 161088040-161088190 | ADAMTS4 | 48.83 |
| chr3: 27763160-27763310 | EOMES | 51.5 |
| chr3: 27763160-27763310 | AC098973.2 | 51.5 |
| chr12: 104532240-104532390 | HCFC2 | 51.54 |
| chr12: 104532240-104532390 | GLT8D2 | 51.54 |
| chr12: 104532240-104532390 | TXNRD1 | 51.54 |
| chr1: 202777405-202777555 | RP11-480I12.5 | 51.86 |