SOM cluster: 606
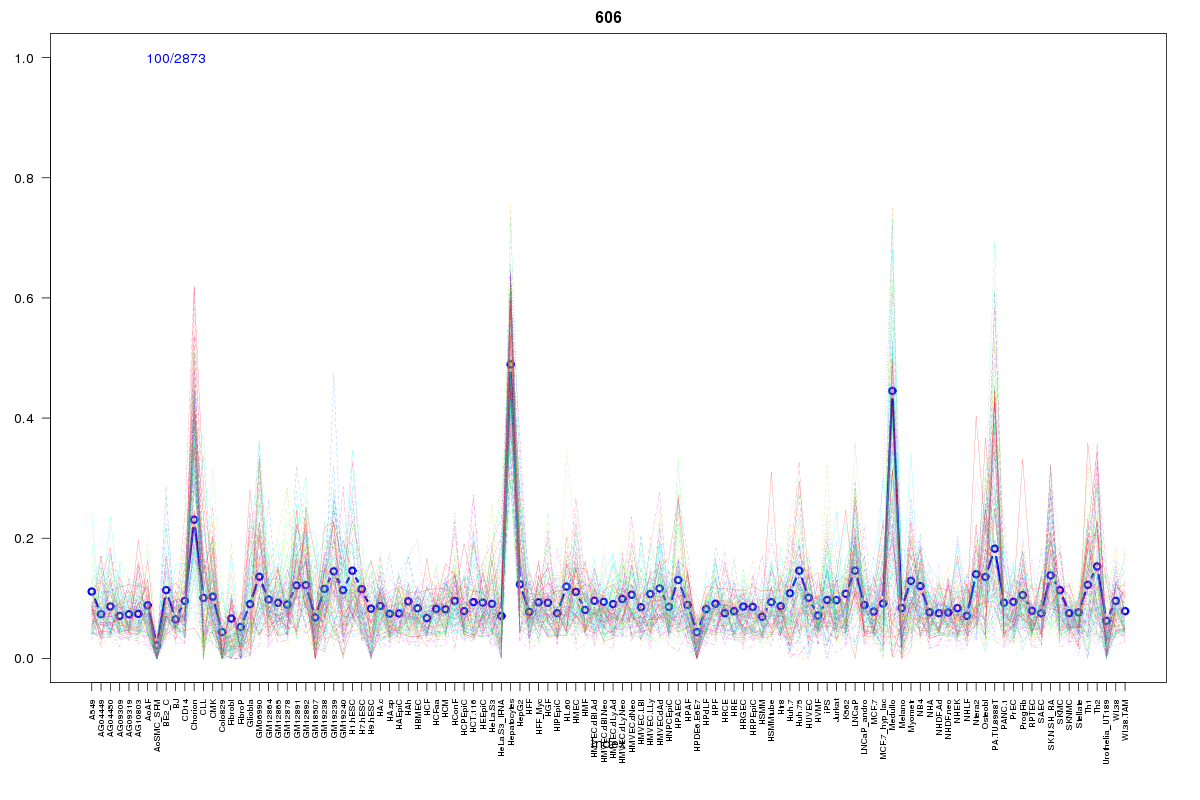
Cluster Hypersensitivity Profile

Genomic Location Trend
These plots show the distribution of the DHS sites surrounding the Transcript Start Site of the nearest gene.
Stats
Number of sites: 2873Promoter: 9%
CpG-Island: 12%
Conserved: 26%
Enriched Motifs & Matches
Match Detail: [Jaspar]
|
| ||
|---|---|---|
| Sites: 57/100 | e-val: 2.6e-25 | ||
| Factor | e-val(match) | DB |
| SP1 | 0.000035021 | JASPAR |
| INSM1 | 0.00075949 | JASPAR |
| PLAG1 | 0.0016181 | JASPAR |
| RREB1 | 0.0019702 | JASPAR |
| Egr1 | 0.0048938 | JASPAR |
|
| ||
| Sites: 70/100 | e-val: 0.000000000000016 | ||
| Factor | e-val(match) | DB |
| EBF1 | 0.00000090277 | JASPAR |
| TFAP2A | 0.00017991 | JASPAR |
| Zfp423 | 0.00053506 | JASPAR |
| INSM1 | 0.00059097 | JASPAR |
| PLAG1 | 0.0023991 | JASPAR |
|
| ||
| Sites: 34/100 | e-val: 0.0000091 | ||
| Factor | e-val(match) | DB |
| ESR1 | 0.00026293 | JASPAR |
| TP53 | 0.0018555 | JASPAR |
| SP1 | 0.0023515 | JASPAR |
| PPARG::RXRA | 0.0061039 | JASPAR |
| ESR2 | 0.0084674 | JASPAR |
BED file downloads
Top 10 Example Regions
| Location | Gene Link | Dist. |
|---|---|---|
| chr1: 1103625-1103775 | MIR200A | 27.85 |
| chr3: 126731865-126732015 | PLXNA1 | 34.83 |
| chr17: 61552625-61552775 | ACE | 41.83 |
| chr19: 35631585-35631735 | CTD-2527I21.4 | 44.45 |
| chr1: 203015845-203016115 | RP11-335O13.7 | 45.04 |
| chr14: 104634285-104634435 | RP11-260M19.2 | 48.74 |
| chr9: 133350865-133351095 | snoU13 | 49.37 |
| chr19: 33444385-33444535 | SLC7A9 | 49.8 |
| chr11: 65638765-65638915 | CTSW | 50.13 |
| chr22: 46510560-46510710 | PPARA | 50.29 |