SOM cluster: 623
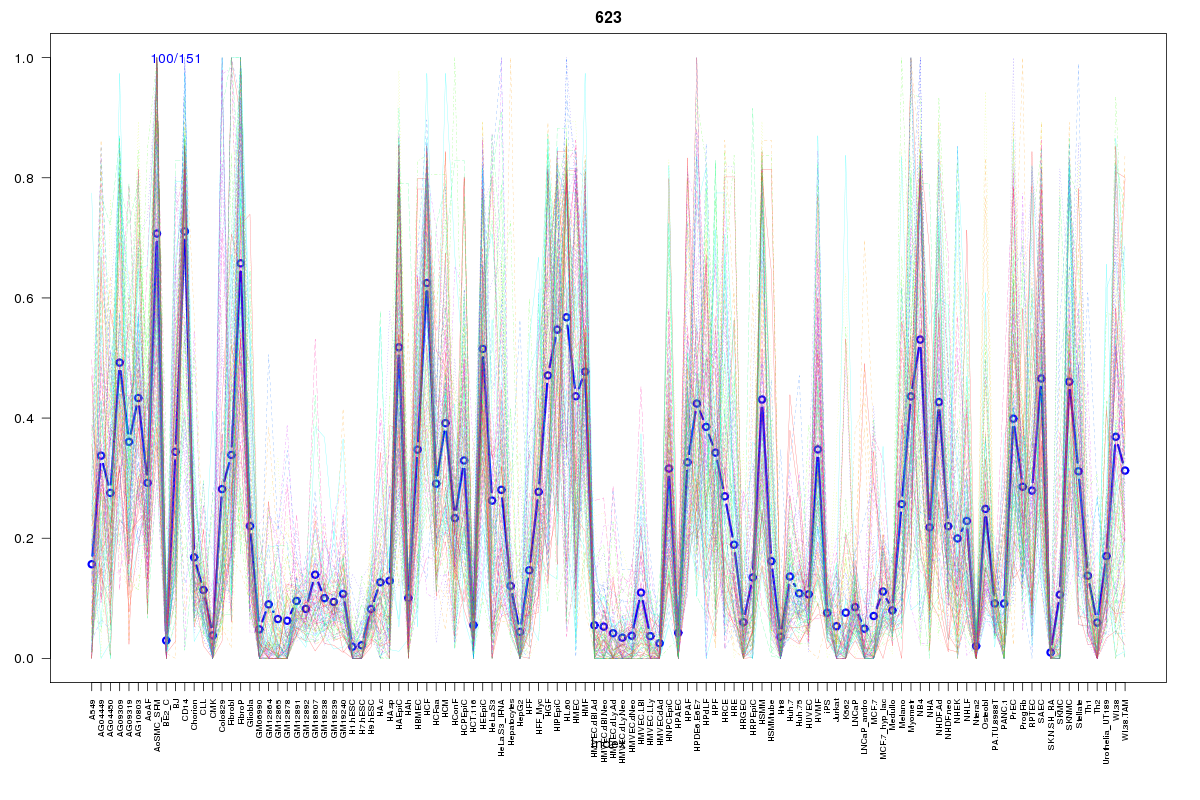
Cluster Hypersensitivity Profile

Genomic Location Trend
These plots show the distribution of the DHS sites surrounding the Transcript Start Site of the nearest gene.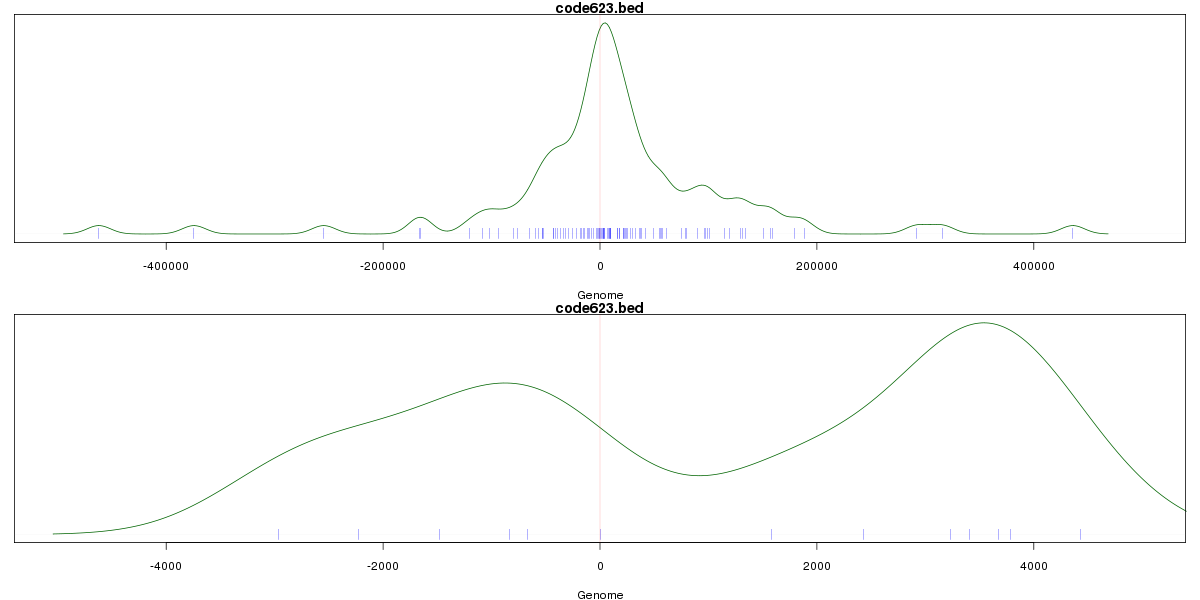
Stats
Number of sites: 151Promoter: 5%
CpG-Island: 0%
Conserved: 26%
Enriched Motifs & Matches
Match Detail: [Jaspar]
|
| ||
|---|---|---|
| Sites: 43/100 | e-val: 5.6e-16 | ||
| Factor | e-val(match) | DB |
| HLF | 0.0000012818 | JASPAR |
| CEBPA | 0.0000042314 | JASPAR |
| NFIL3 | 0.000010891 | JASPAR |
| Lhx3 | 0.0002011 | JASPAR |
| Foxa2 | 0.0033998 | JASPAR |
|
| ||
| Sites: 29/100 | e-val: 0.00000047 | ||
| Factor | e-val(match) | DB |
| AP1 | 0.0000000087138 | JASPAR |
| NFE2L2 | 0.0000071543 | JASPAR |
| Pax6 | 0.005762 | JASPAR |
| NFE2L1::MafG | 0.024641 | JASPAR |
| PBX1 | 0.028568 | JASPAR |
BED file downloads
Top 10 Example Regions
| Location | Gene Link | Dist. |
|---|---|---|
| chr5: 139934120-139934270 | SRA1 | 45.79 |
| chr5: 139982620-139982770 | ANKHD1-EIF4EBP3 | 51.91 |
| chr5: 139982620-139982770 | HARS2 | 51.91 |
| chr5: 139982620-139982770 | ZMAT2 | 51.91 |
| chr5: 139982620-139982770 | TMCO6 | 51.91 |
| chr5: 139982620-139982770 | HARS | 51.91 |
| chr5: 139982620-139982770 | NDUFA2 | 51.91 |
| chr5: 139982620-139982770 | SLC35A4 | 51.91 |
| chr5: 139982620-139982770 | ANKHD1 | 51.91 |
| chr14: 51404160-51404310 | PYGL | 56.31 |