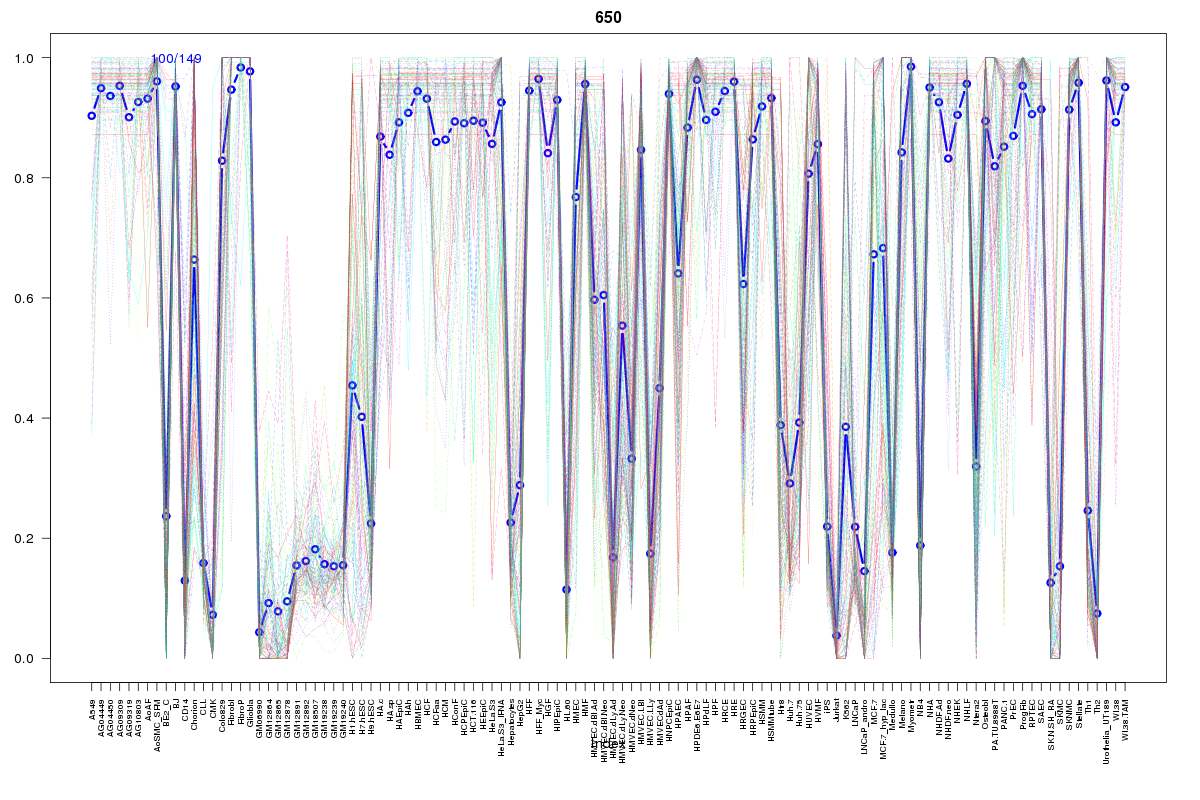
SOM cluster: 650
Cluster Hypersensitivity Profile

Genomic Location Trend
These plots show the distribution of the DHS sites surrounding the Transcript Start Site of the nearest gene.
Stats
Number of sites: 149Promoter: 6%
CpG-Island: 0%
Conserved: 58%
Enriched Motifs & Matches
Match Detail: [Jaspar]
|
| ||
|---|---|---|
| Sites: 70/100 | e-val: 0 | ||
| Factor | e-val(match) | DB |
| NFE2L2 | 0.00000000023365 | JASPAR |
| AP1 | 0.000000010552 | JASPAR |
| NFE2L1::MafG | 0.0090073 | JASPAR |
| PBX1 | 0.014249 | JASPAR |
| Pax6 | 0.019305 | JASPAR |
BED file downloads
Top 10 Example Regions
| Location | Gene Link | Dist. |
|---|---|---|
| chr7: 46017780-46017930 | IGFBP3 | 32.62 |
| chr18: 46156500-46156650 | CTIF | 37.23 |
| chr18: 46469020-46469170 | SMAD7 | 40.68 |
| chr2: 38918080-38918230 | SRSF7 | 48.44 |
| chr2: 11514760-11514910 | ROCK2 | 50.91 |
| chr2: 11514760-11514910 | AC099344.3 | 50.91 |
| chr2: 11514760-11514910 | E2F6 | 50.91 |
| chr2: 11514760-11514910 | AC018463.5 | 50.91 |
| chr2: 11514760-11514910 | AC018463.4 | 50.91 |
| chr11: 68122060-68122210 | C11orf24 | 53.14 |