SOM cluster: 651
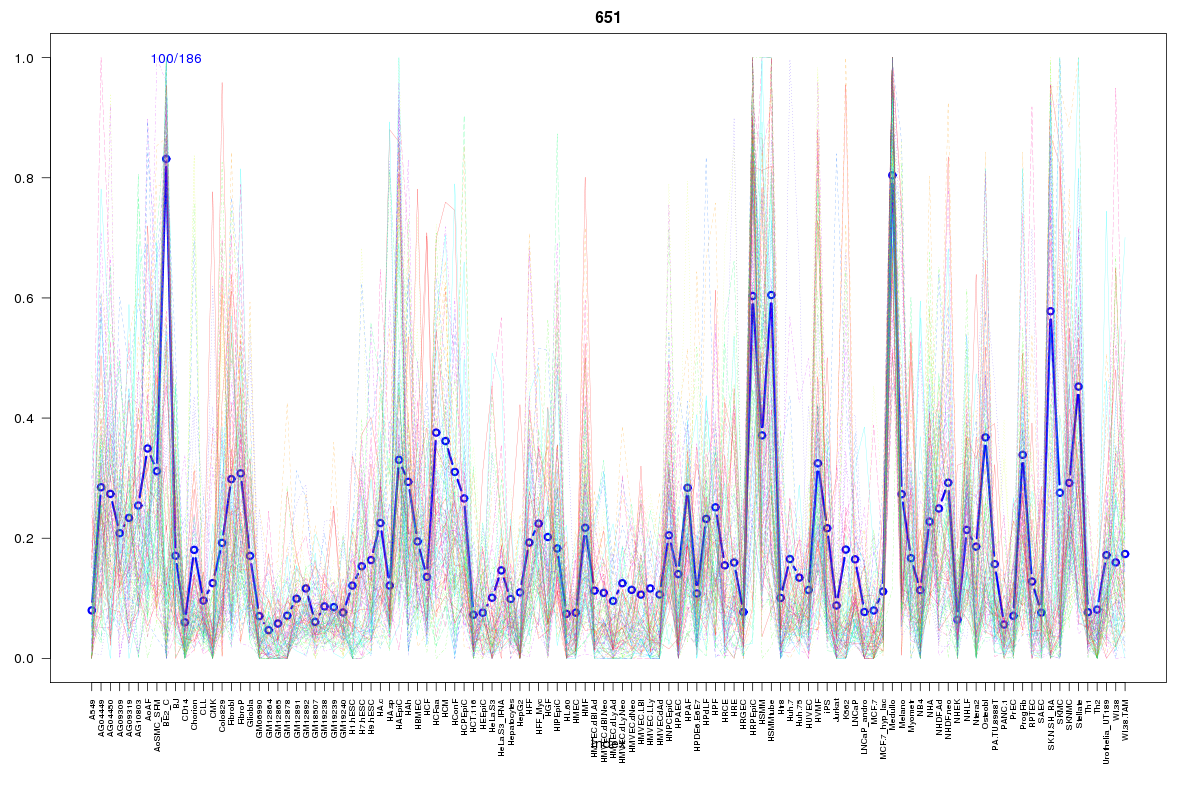
Cluster Hypersensitivity Profile

Genomic Location Trend
These plots show the distribution of the DHS sites surrounding the Transcript Start Site of the nearest gene.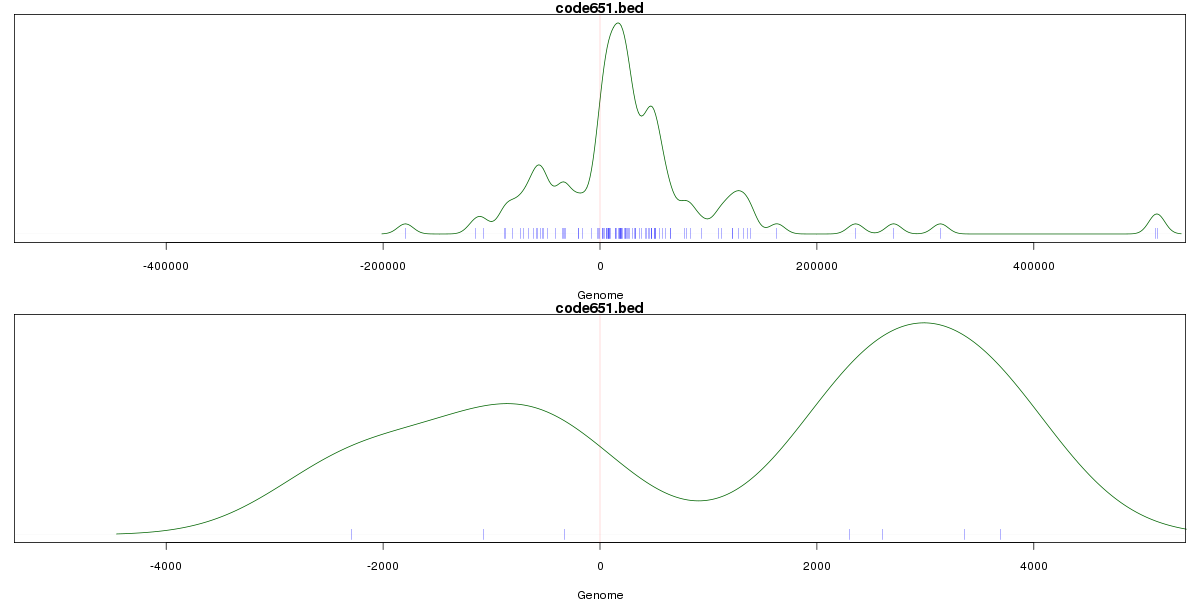
Stats
Number of sites: 186Promoter: 2%
CpG-Island: 3%
Conserved: 52%
Enriched Motifs & Matches
Match Detail: [Jaspar]
|
| ||
|---|---|---|
| Sites: 31/100 | e-val: 0.00000014 | ||
| Factor | e-val(match) | DB |
| EBF1 | 0.0000000086823 | JASPAR |
| TFAP2A | 0.00035543 | JASPAR |
| CTCF | 0.00044068 | JASPAR |
| Stat3 | 0.00055833 | JASPAR |
| MZF1_1-4 | 0.002069 | JASPAR |
|
| ||
| Sites: 23/100 | e-val: 0.15 | ||
| Factor | e-val(match) | DB |
| SPIB | 0.00069828 | JASPAR |
| ARID3A | 0.00099013 | JASPAR |
| NR3C1 | 0.0027845 | JASPAR |
| Prrx2 | 0.0076491 | JASPAR |
| GATA2 | 0.012738 | JASPAR |
|
| ||
| Sites: 29/100 | e-val: 0.81 | ||
| Factor | e-val(match) | DB |
| SP1 | 0.0000013505 | JASPAR |
| Tal1::Gata1 | 0.0004096 | JASPAR |
| Pax4 | 0.00063083 | JASPAR |
| MZF1_5-13 | 0.0026111 | JASPAR |
| SPIB | 0.002642 | JASPAR |
BED file downloads
Top 10 Example Regions
| Location | Gene Link | Dist. |
|---|---|---|
| chr9: 95967820-95967970 | WNK2 | 57.02 |
| chr5: 149895640-149895790 | snoU13 | 61.39 |
| chr1: 202592280-202592430 | PPP1R12B | 63.34 |
| chr7: 73448245-73448395 | ELN | 65.9 |
| chr6: 15432060-15432210 | DTNBP1 | 66.6 |
| chr6: 84761920-84762070 | RP11-51G5.1 | 68.36 |
| chr17: 76895460-76895610 | USP36 | 70.74 |
| chr17: 76895460-76895610 | LGALS3BP | 70.74 |
| chr17: 76895460-76895610 | TIMP2 | 70.74 |
| chr12: 122205680-122205830 | RHOF | 71.38 |