SOM cluster: 657
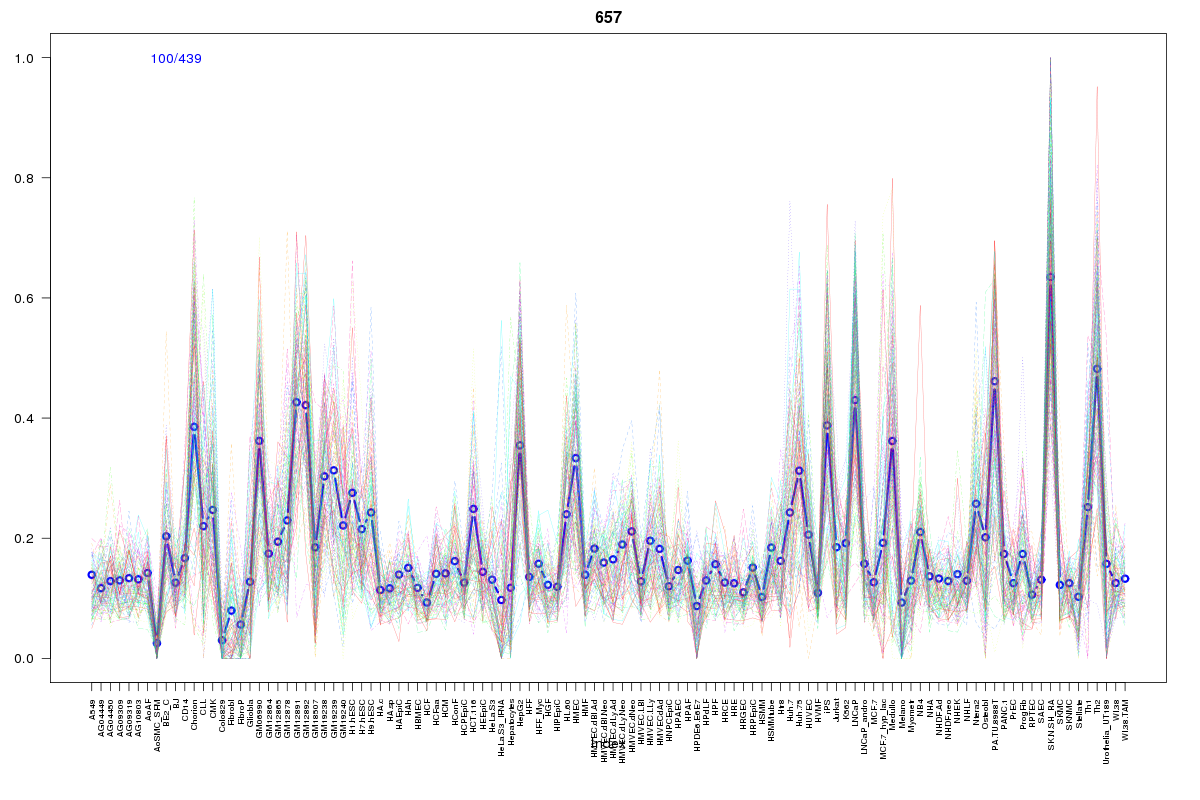
Cluster Hypersensitivity Profile

Genomic Location Trend
These plots show the distribution of the DHS sites surrounding the Transcript Start Site of the nearest gene.
Stats
Number of sites: 439Promoter: 26%
CpG-Island: 83%
Conserved: 56%
Enriched Motifs & Matches
Match Detail: [Jaspar]
|
| ||
|---|---|---|
| Sites: 99/100 | e-val: 0 | ||
| Factor | e-val(match) | DB |
| SP1 | 0.00000021613 | JASPAR |
| TFAP2A | 0.0010453 | JASPAR |
| Klf4 | 0.0054756 | JASPAR |
| TP53 | 0.046971 | JASPAR |
| REST | 0.048081 | JASPAR |
|
| ||
| Sites: 89/100 | e-val: 5.10003e-41 | ||
| Factor | e-val(match) | DB |
| TFAP2A | 0.0000039855 | JASPAR |
| SP1 | 0.010886 | JASPAR |
| PLAG1 | 0.017806 | JASPAR |
| MZF1_1-4 | 0.033369 | JASPAR |
| Zfx | 0.041412 | JASPAR |
|
| ||
| Sites: 83/100 | e-val: 0.000000000024 | ||
| Factor | e-val(match) | DB |
| SP1 | 0.000000048914 | JASPAR |
| INSM1 | 0.000035234 | JASPAR |
| Klf4 | 0.00064464 | JASPAR |
| PPARG::RXRA | 0.0016039 | JASPAR |
| TFAP2A | 0.0017627 | JASPAR |
BED file downloads
Top 10 Example Regions
| Location | Gene Link | Dist. |
|---|---|---|
| chr22: 19744425-19744575 | GNB1L | 40.4 |
| chr4: 2043285-2043435 | RP11-317B7.2 | 41.15 |
| chr9: 139607060-139607210 | CCDC183-AS1 | 45.47 |
| chr2: 127534400-127534550 | RNU6-675P | 46.09 |
| chr11: 63804825-63804975 | RP11-21A7A.4 | 50.47 |
| chr17: 8029280-8029430 | AURKB | 51.35 |
| chr17: 8029280-8029430 | PER1 | 51.35 |
| chr17: 8029280-8029430 | ALOX15B | 51.35 |
| chr17: 8029280-8029430 | CTC1 | 51.35 |
| chr16: 72965-73115 | WASH4P | 54.47 |