SOM cluster: 674
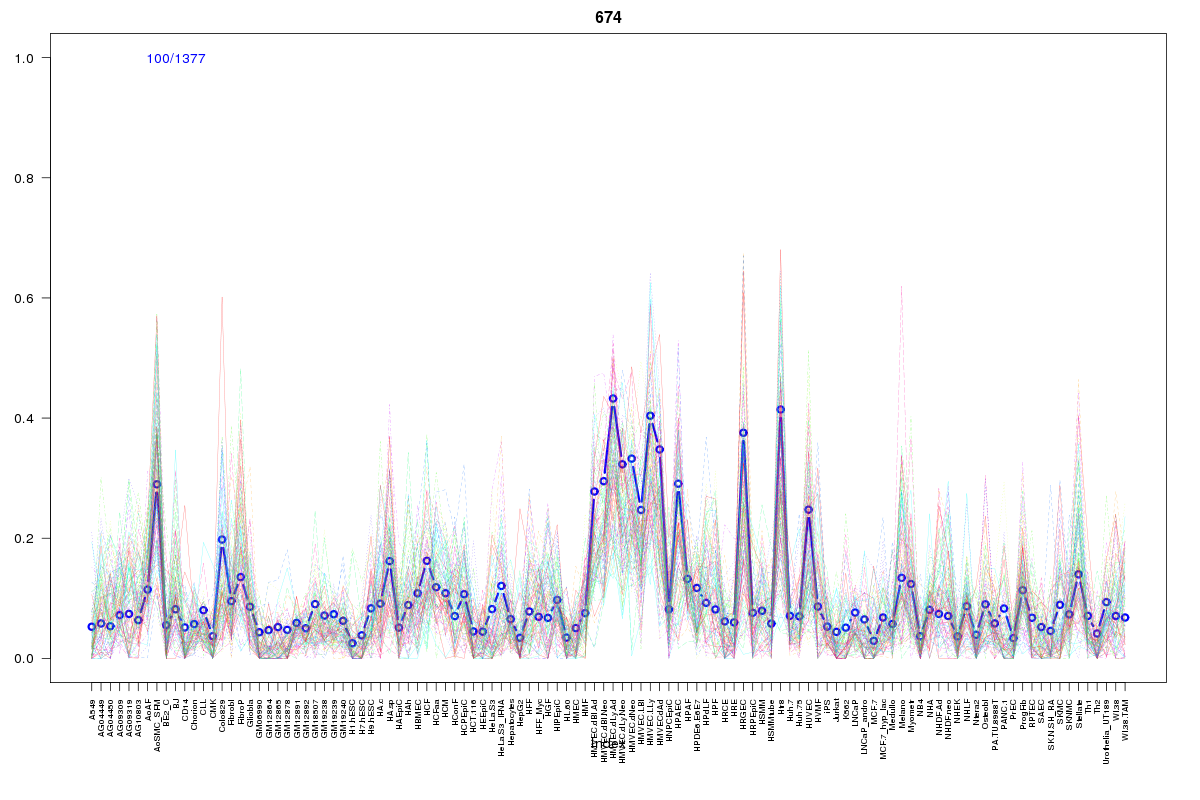
Cluster Hypersensitivity Profile

Genomic Location Trend
These plots show the distribution of the DHS sites surrounding the Transcript Start Site of the nearest gene.
Stats
Number of sites: 1377Promoter: 2%
CpG-Island: 0%
Conserved: 45%
Enriched Motifs & Matches
Match Detail: [Jaspar]
|
| ||
|---|---|---|
| Sites: 45/100 | e-val: 0.000000000004 | ||
| Factor | e-val(match) | DB |
| Foxd3 | 0.0000027321 | JASPAR |
| MEF2A | 0.00010646 | JASPAR |
| Lhx3 | 0.0028361 | JASPAR |
| ARID3A | 0.0035716 | JASPAR |
| Foxq1 | 0.005178 | JASPAR |
|
| ||
| Sites: 28/100 | e-val: 0.000044 | ||
| Factor | e-val(match) | DB |
| EWSR1-FLI1 | 0.000098745 | JASPAR |
| Foxd3 | 0.0014357 | JASPAR |
| SOX9 | 0.019978 | JASPAR |
| IRF2 | 0.020831 | JASPAR |
| SOX10 | 0.022973 | JASPAR |
BED file downloads
Top 10 Example Regions
| Location | Gene Link | Dist. |
|---|---|---|
| chr10: 121706960-121707110 | MCMBP | 27.13 |
| chr10: 13679620-13679770 | RP11-295P9.2 | 32.5 |
| chr10: 13679620-13679770 | FRMD4A | 32.5 |
| chr1: 198799300-198799450 | MIR181B1 | 33.64 |
| chr19: 779360-779510 | PALM | 39.31 |
| chr19: 779360-779510 | PRTN3 | 39.31 |
| chr8: 6419660-6419810 | CTD-2541M15.1 | 39.56 |
| chr8: 6419660-6419810 | RP11-115C21.4 | 39.56 |
| chr12: 89740920-89741070 | DUSP6 | 40.13 |
| chr12: 89740920-89741070 | POC1B | 40.13 |