SOM cluster: 68
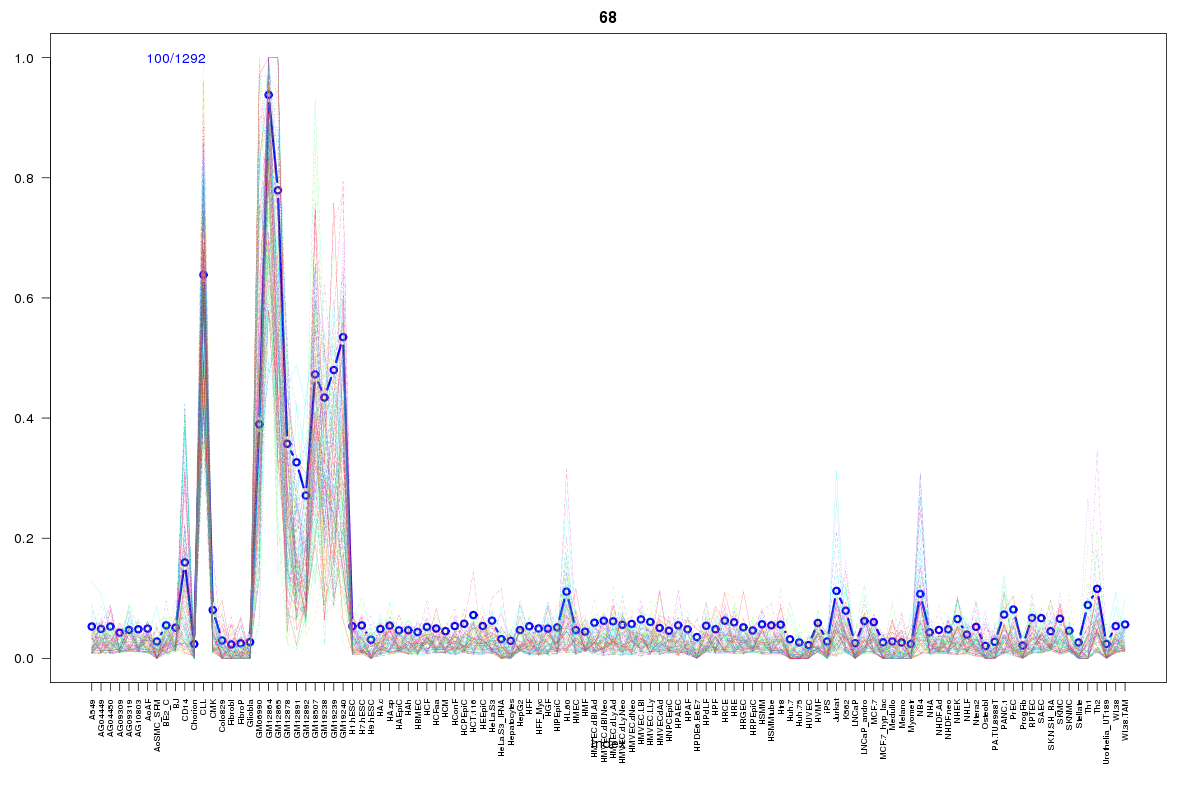
Cluster Hypersensitivity Profile

Genomic Location Trend
These plots show the distribution of the DHS sites surrounding the Transcript Start Site of the nearest gene.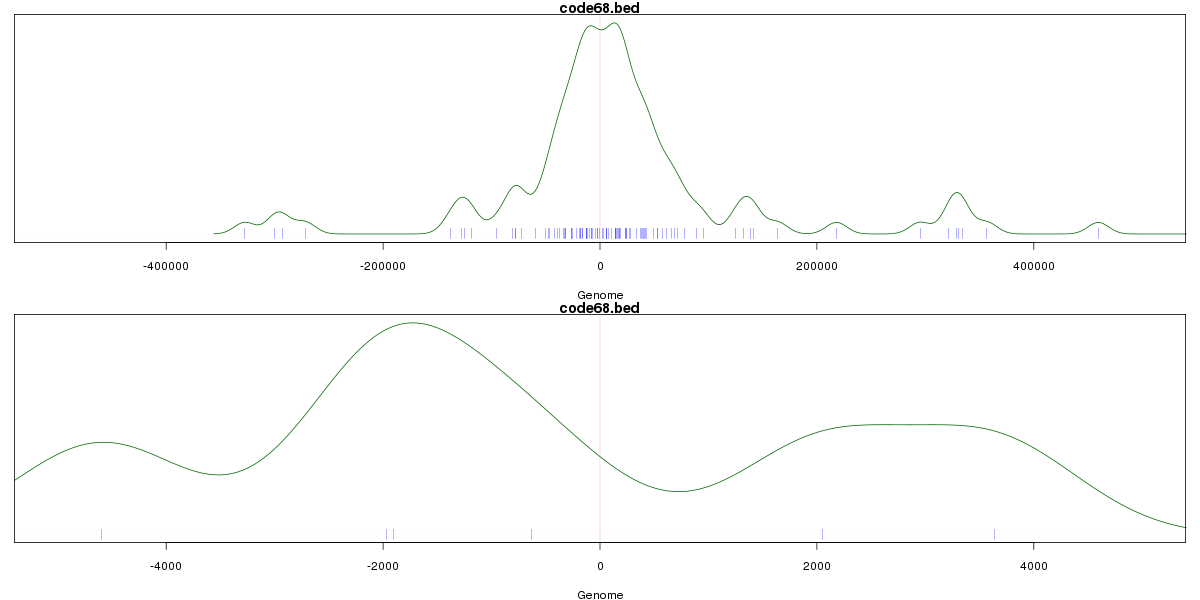
Stats
Number of sites: 1292Promoter: 3%
CpG-Island: 0%
Conserved: 28%
Enriched Motifs & Matches
Match Detail: [Jaspar]
|
| ||
|---|---|---|
| Sites: 43/100 | e-val: 8.5e-41 | ||
| Factor | e-val(match) | DB |
| SPI1 | 0.0000077831 | JASPAR |
| SPIB | 0.000048413 | JASPAR |
| IRF1 | 0.000065165 | JASPAR |
| FEV | 0.0015939 | JASPAR |
| ELF5 | 0.0052211 | JASPAR |
BED file downloads
Top 10 Example Regions
| Location | Gene Link | Dist. |
|---|---|---|
| chr10: 5904185-5904335 | FBXO18 | 31.04 |
| chr12: 768340-768490 | NINJ2 | 32.28 |
| chr12: 768340-768490 | RP11-218M22.1 | 32.28 |
| chr9: 36877400-36877550 | PAX5 | 37.13 |
| chr9: 36877400-36877550 | RP11-344B23.2 | 37.13 |
| chr12: 93389160-93389310 | RP11-511B23.1 | 39.59 |
| chr8: 52365160-52365310 | RP11-119N19.1 | 40.32 |
| chr7: 106766880-106767030 | PRKAR2B | 41.22 |
| chr2: 25008660-25008810 | NCOA1 | 41.69 |
| chr22: 39862800-39862950 | MIEF1 | 45.34 |