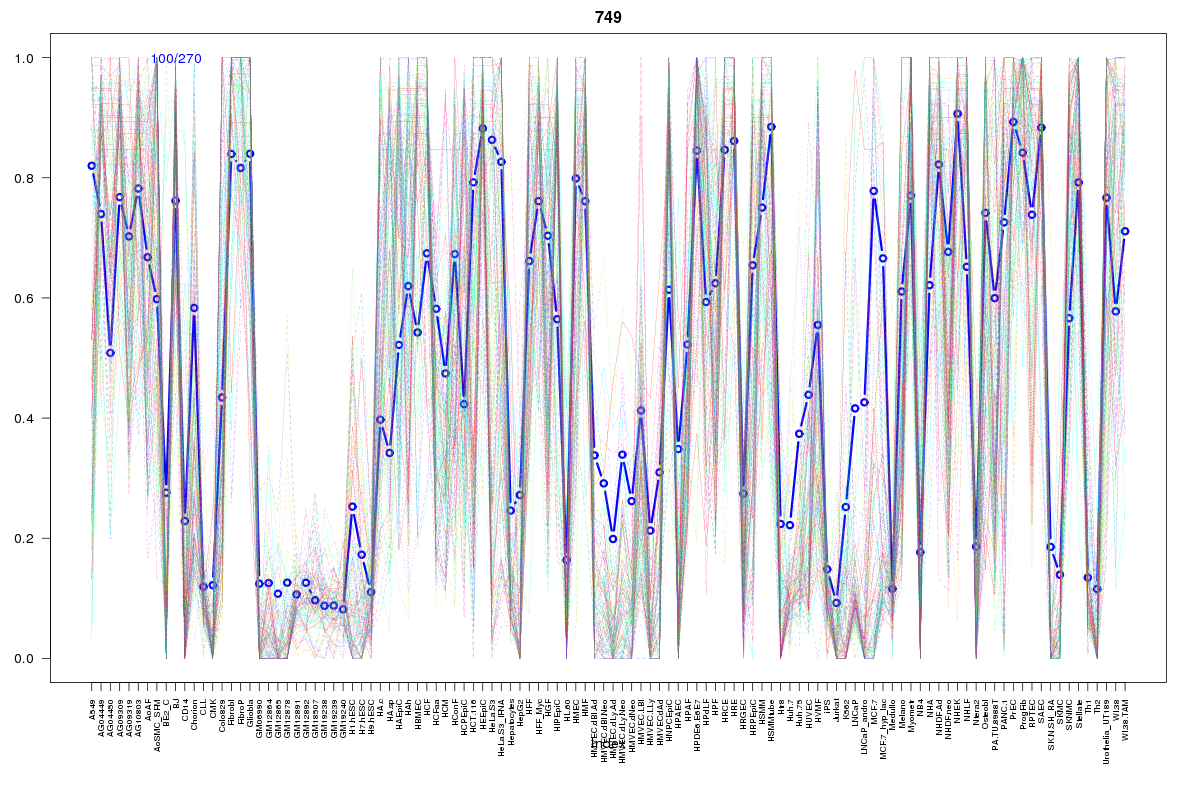
SOM cluster: 749
Cluster Hypersensitivity Profile

Genomic Location Trend
These plots show the distribution of the DHS sites surrounding the Transcript Start Site of the nearest gene.
Stats
Number of sites: 270Promoter: 2%
CpG-Island: 0%
Conserved: 42%
Enriched Motifs & Matches
Match Detail: [Jaspar]
|
| ||
|---|---|---|
| Sites: 60/100 | e-val: 1.8e-29 | ||
| Factor | e-val(match) | DB |
| AP1 | 0.000000000016189 | JASPAR |
| NFE2L2 | 0.0000000065567 | JASPAR |
| PPARG | 0.0036811 | JASPAR |
| NFE2L1::MafG | 0.0059469 | JASPAR |
| Foxa2 | 0.012998 | JASPAR |
BED file downloads
Top 10 Example Regions
| Location | Gene Link | Dist. |
|---|---|---|
| chr7: 129932965-129933115 | CPA4 | 39.25 |
| chr7: 129932965-129933115 | snoU13 | 39.25 |
| chr12: 13288860-13289010 | EMP1 | 50.19 |
| chr12: 13288860-13289010 | RP11-377D9.3 | 50.19 |
| chr1: 115732880-115733030 | RP4-666F24.3 | 53.56 |
| chr1: 115732880-115733030 | NGF | 53.56 |
| chr1: 210771260-210771410 | HHAT | 54.85 |
| chr1: 210771260-210771410 | KCNH1 | 54.85 |
| chrX: 149857660-149857810 | CD99L2 | 55.48 |
| chr10: 128148780-128148930 | C10orf90 | 59.22 |