SOM cluster: 756
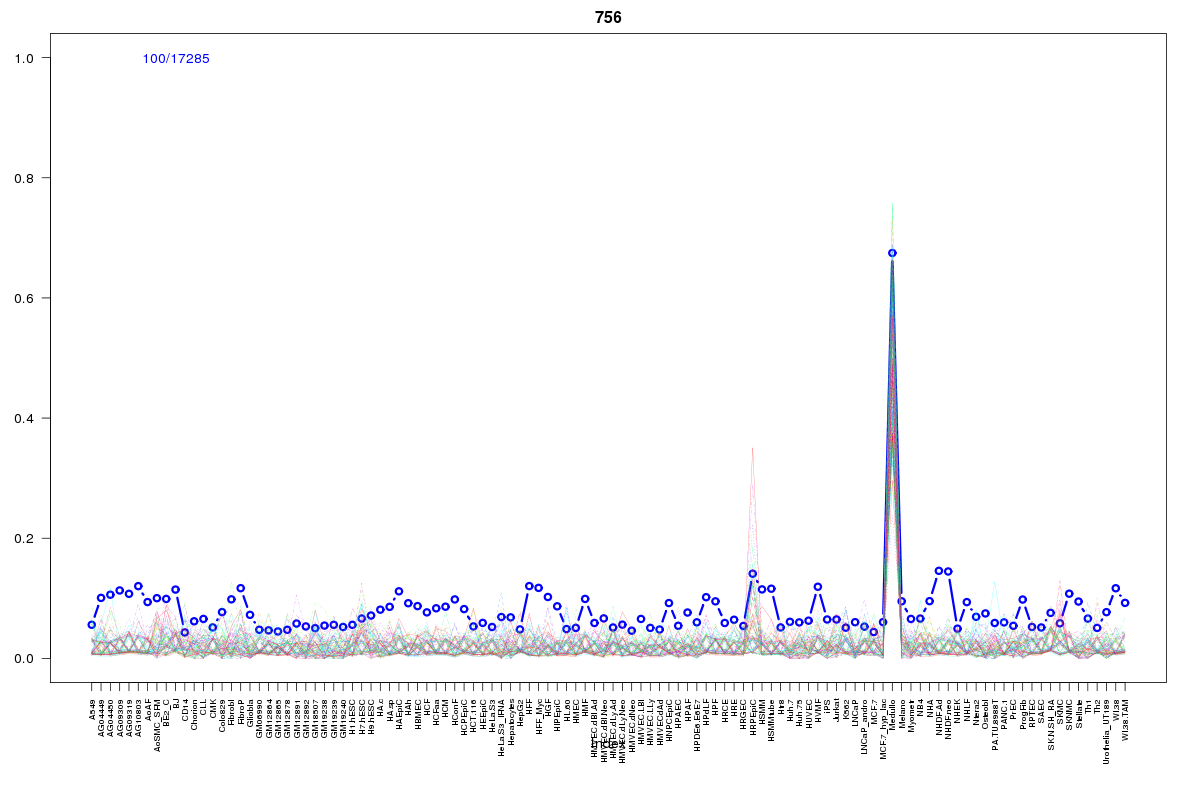
Cluster Hypersensitivity Profile

Genomic Location Trend
These plots show the distribution of the DHS sites surrounding the Transcript Start Site of the nearest gene.
Stats
Number of sites: 17285Promoter: 2%
CpG-Island: 0%
Conserved: 32%
Enriched Motifs & Matches
Match Detail: [Jaspar]
|
| ||
|---|---|---|
| Sites: 21/100 | e-val: 0.93 | ||
| Factor | e-val(match) | DB |
| ARID3A | 0.000048345 | JASPAR |
| REL | 0.013305 | JASPAR |
| Prrx2 | 0.029636 | JASPAR |
| Nkx2-5 | 0.033414 | JASPAR |
| Pdx1 | 0.035267 | JASPAR |
BED file downloads
Top 10 Example Regions
| Location | Gene Link | Dist. |
|---|---|---|
| chr1: 151037065-151037215 | FAM63A | 17.04 |
| chr1: 151037065-151037215 | MLLT11 | 17.04 |
| chr1: 151037065-151037215 | PRUNE | 17.04 |
| chr1: 151267065-151267215 | ZNF687 | 18.1 |
| chr19: 38782660-38782810 | SIPA1L3 | 25.46 |
| chr1: 145552185-145552335 | GNRHR2 | 34.07 |
| chr3: 47578085-47578235 | CSPG5 | 34.64 |
| chr9: 139436765-139436915 | C9orf163 | 36.45 |
| chr10: 18686980-18687130 | CACNB2 | 37.99 |
| chr1: 180157745-180157895 | RP5-1180C10.2 | 38.22 |