SOM cluster: 827
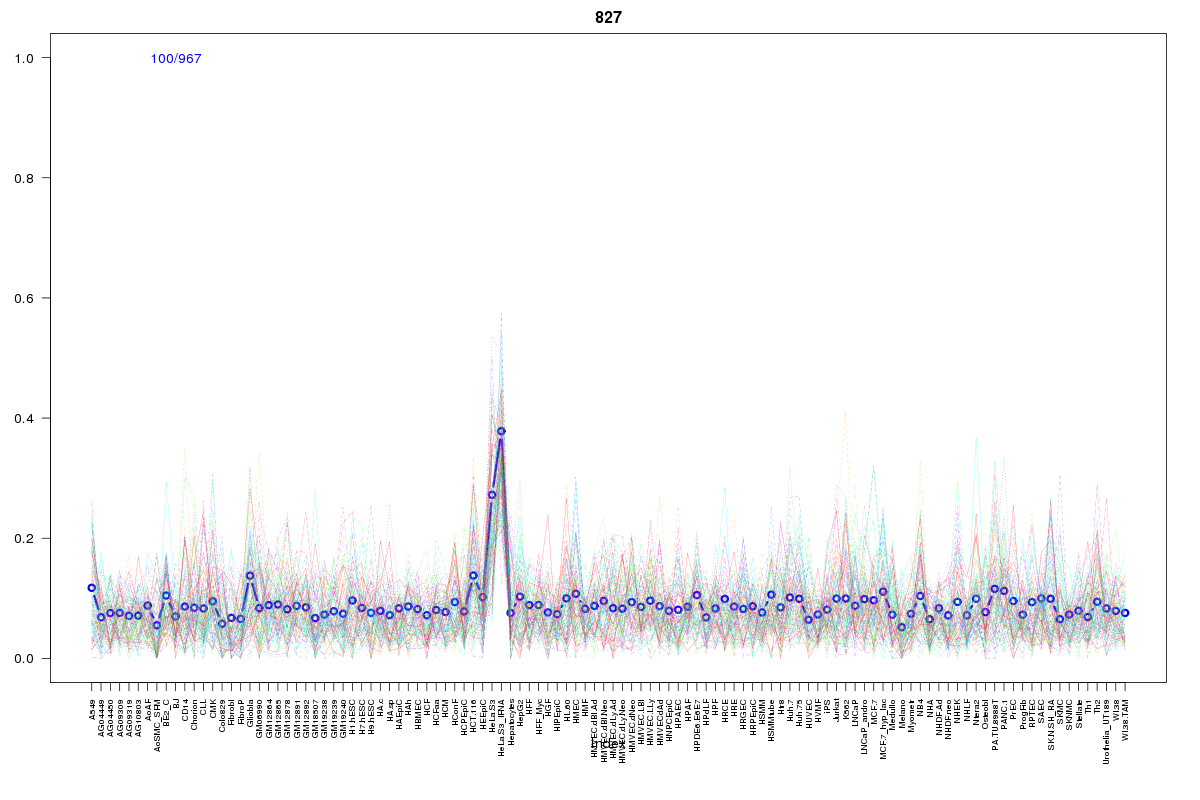
Cluster Hypersensitivity Profile

Genomic Location Trend
These plots show the distribution of the DHS sites surrounding the Transcript Start Site of the nearest gene.
Stats
Number of sites: 967Promoter: 15%
CpG-Island: 4%
Conserved: 23%
Enriched Motifs & Matches
Match Detail: [Jaspar]
|
| ||
|---|---|---|
| Sites: 21/100 | e-val: 0.000000017 | ||
| Factor | e-val(match) | DB |
| Pax4 | 0.000000000042049 | JASPAR |
| SP1 | 0.0000033321 | JASPAR |
| RREB1 | 0.000032893 | JASPAR |
| Klf4 | 0.0039918 | JASPAR |
| MZF1_1-4 | 0.00721 | JASPAR |
|
| ||
| Sites: 19/100 | e-val: 0.053 | ||
| Factor | e-val(match) | DB |
| Myf | 0.0000019192 | JASPAR |
| Spz1 | 0.0050111 | JASPAR |
| Tal1::Gata1 | 0.0071456 | JASPAR |
| NHLH1 | 0.011359 | JASPAR |
| SP1 | 0.026265 | JASPAR |
BED file downloads
Top 10 Example Regions
| Location | Gene Link | Dist. |
|---|---|---|
| chr1: 150848245-150848395 | CTSK | 12.99 |
| chr1: 150848245-150848395 | RP11-316M1.12 | 12.99 |
| chr1: 150480145-150480295 | TARS2 | 22.59 |
| chr12: 50303925-50304075 | BCDIN3D-AS1 | 44.33 |
| chr17: 74812505-74812655 | MGAT5B | 48.2 |
| chr17: 74812505-74812655 | METTL23 | 48.2 |
| chr12: 49668220-49668370 | TUBA1C | 49.17 |
| chr12: 49668220-49668370 | RP11-161H23.5 | 49.17 |
| chr12: 49668220-49668370 | TROAP | 49.17 |
| chr9: 138453380-138453530 | PAEP | 50.17 |