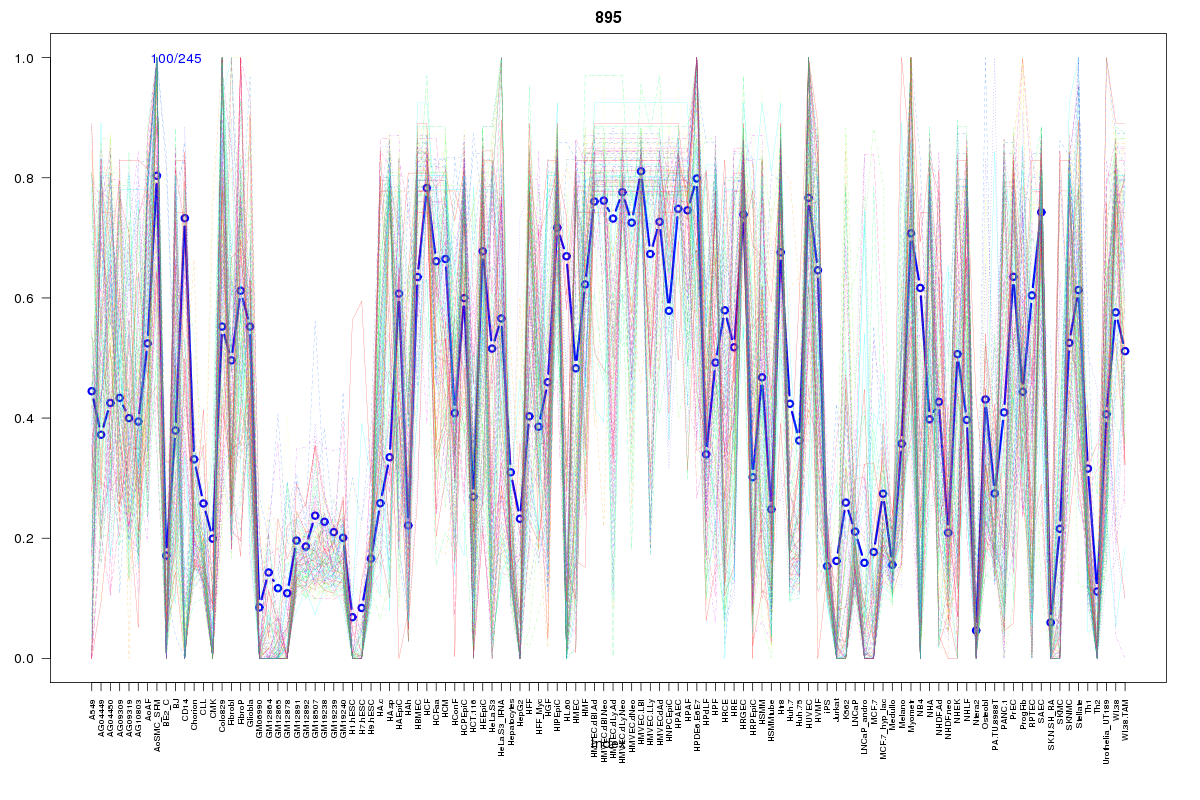
SOM cluster: 895
Cluster Hypersensitivity Profile

Genomic Location Trend
These plots show the distribution of the DHS sites surrounding the Transcript Start Site of the nearest gene.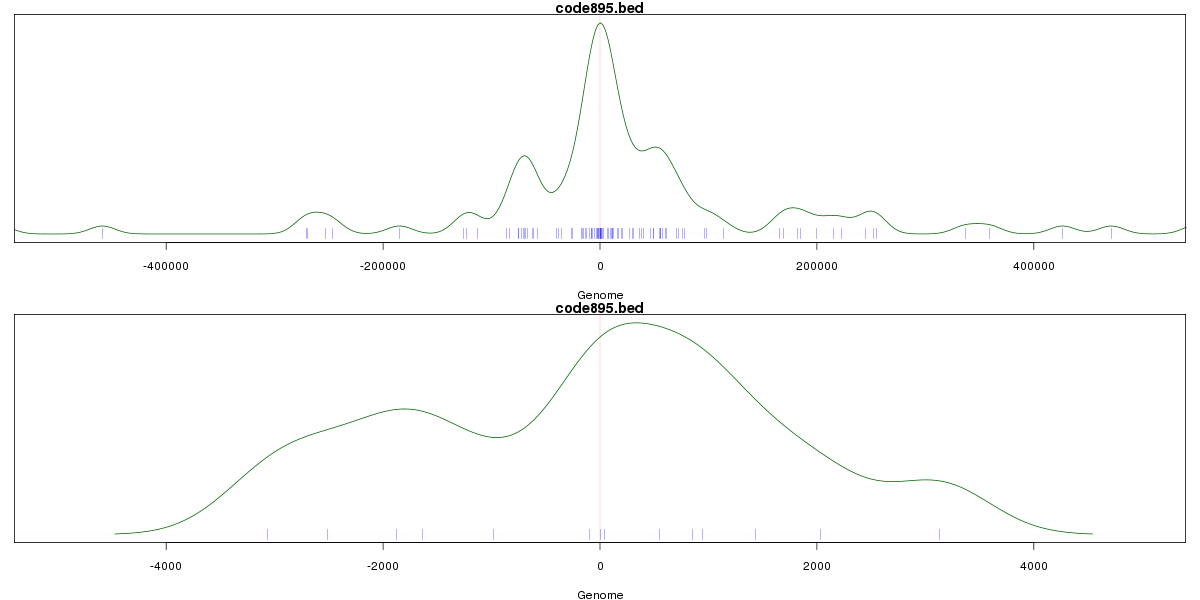
Stats
Number of sites: 245Promoter: 5%
CpG-Island: 0%
Conserved: 51%
Enriched Motifs & Matches
Match Detail: [Jaspar]
|
| ||
|---|---|---|
| Sites: 53/100 | e-val: 7.5e-34 | ||
| Factor | e-val(match) | DB |
| AP1 | 0.00000000039427 | JASPAR |
| NFE2L2 | 0.000000001795 | JASPAR |
| NFE2L1::MafG | 0.00064321 | JASPAR |
| PBX1 | 0.0032155 | JASPAR |
| Pax2 | 0.0065091 | JASPAR |
|
| ||
| Sites: 25/100 | e-val: 0.00044 | ||
| Factor | e-val(match) | DB |
| Foxd3 | 0.000067828 | JASPAR |
| Pax4 | 0.00070069 | JASPAR |
| FOXI1 | 0.0033165 | JASPAR |
| Foxq1 | 0.0039658 | JASPAR |
| NFATC2 | 0.017333 | JASPAR |
BED file downloads
Top 10 Example Regions
| Location | Gene Link | Dist. |
|---|---|---|
| chr8: 122612420-122612570 | HAS2 | 30.86 |
| chr8: 122612420-122612570 | HAS2-AS1 | 30.86 |
| chr7: 106808420-106808570 | HBP1 | 42.22 |
| chr8: 96715940-96716090 | KB-1047C11.2 | 48.01 |
| chr5: 163187600-163187750 | RNU6-168P | 52.96 |
| chr6: 16689300-16689450 | ATXN1 | 56.23 |
| chr17: 62619520-62619670 | SMURF2 | 57.65 |
| chr2: 201651720-201651870 | Y_RNA | 59.46 |
| chr6: 118709600-118709750 | SLC35F1 | 60.12 |
| chr6: 118709600-118709750 | RP11-57K17.1 | 60.12 |