SOM cluster: 939
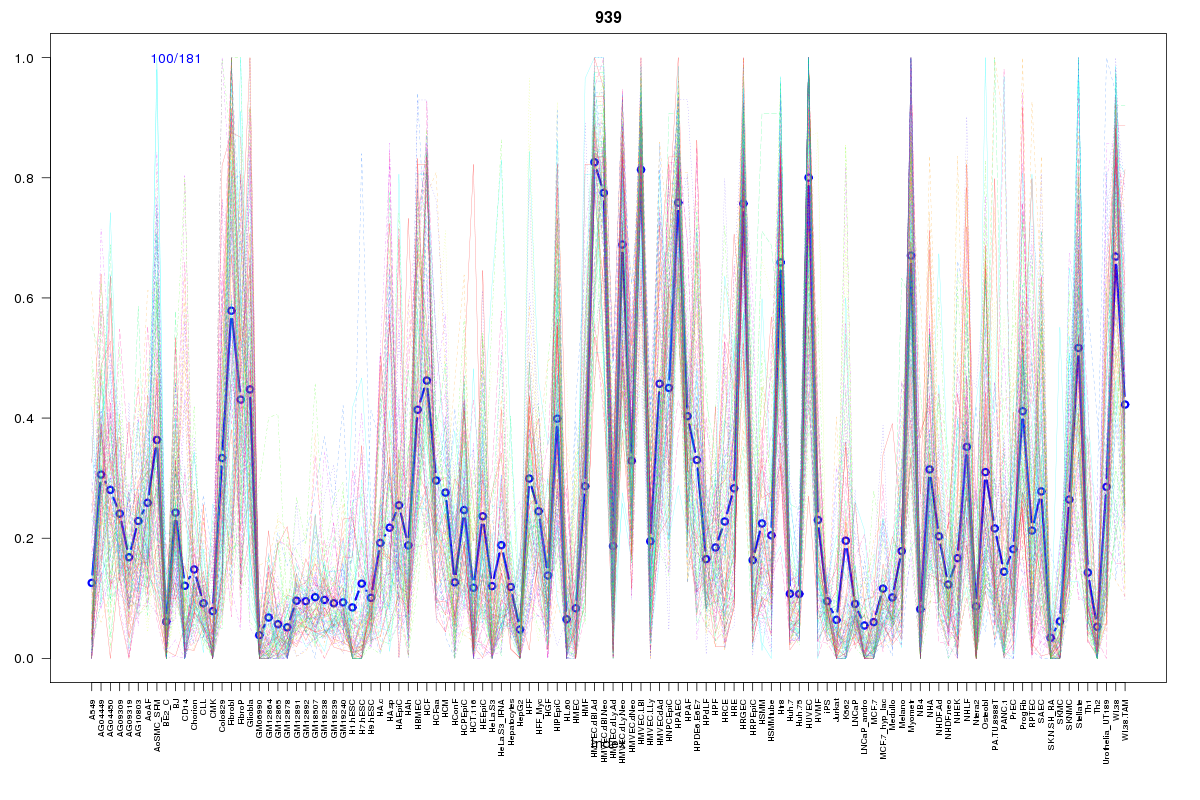
Cluster Hypersensitivity Profile

Genomic Location Trend
These plots show the distribution of the DHS sites surrounding the Transcript Start Site of the nearest gene.
Stats
Number of sites: 181Promoter: 8%
CpG-Island: 0%
Conserved: 34%
Enriched Motifs & Matches
Match Detail: [Jaspar]
|
| ||
|---|---|---|
| Sites: 52/100 | e-val: 9.9e-31 | ||
| Factor | e-val(match) | DB |
| AP1 | 0.00000044592 | JASPAR |
| NFE2L2 | 0.00005611 | JASPAR |
| FEV | 0.00099888 | JASPAR |
| SPIB | 0.0022382 | JASPAR |
| SPI1 | 0.0024907 | JASPAR |
BED file downloads
Top 10 Example Regions
| Location | Gene Link | Dist. |
|---|---|---|
| chr19: 16462340-16462490 | KLF2 | 38.47 |
| chr1: 214589840-214589990 | PTPN14 | 43.22 |
| chr2: 159855120-159855270 | TANC1 | 46.91 |
| chr3: 39220160-39220310 | WDR48 | 53.3 |
| chr19: 34804180-34804330 | PDCD2L | 53.63 |
| chr19: 34804180-34804330 | KIAA0355 | 53.63 |
| chr19: 34804180-34804330 | LSM14A | 53.63 |
| chr13: 45507160-45507310 | NUFIP1 | 56.59 |
| chr13: 45507160-45507310 | GPALPP1 | 56.59 |
| chr10: 101686820-101686970 | DNMBP | 58.04 |