SOM cluster: 949
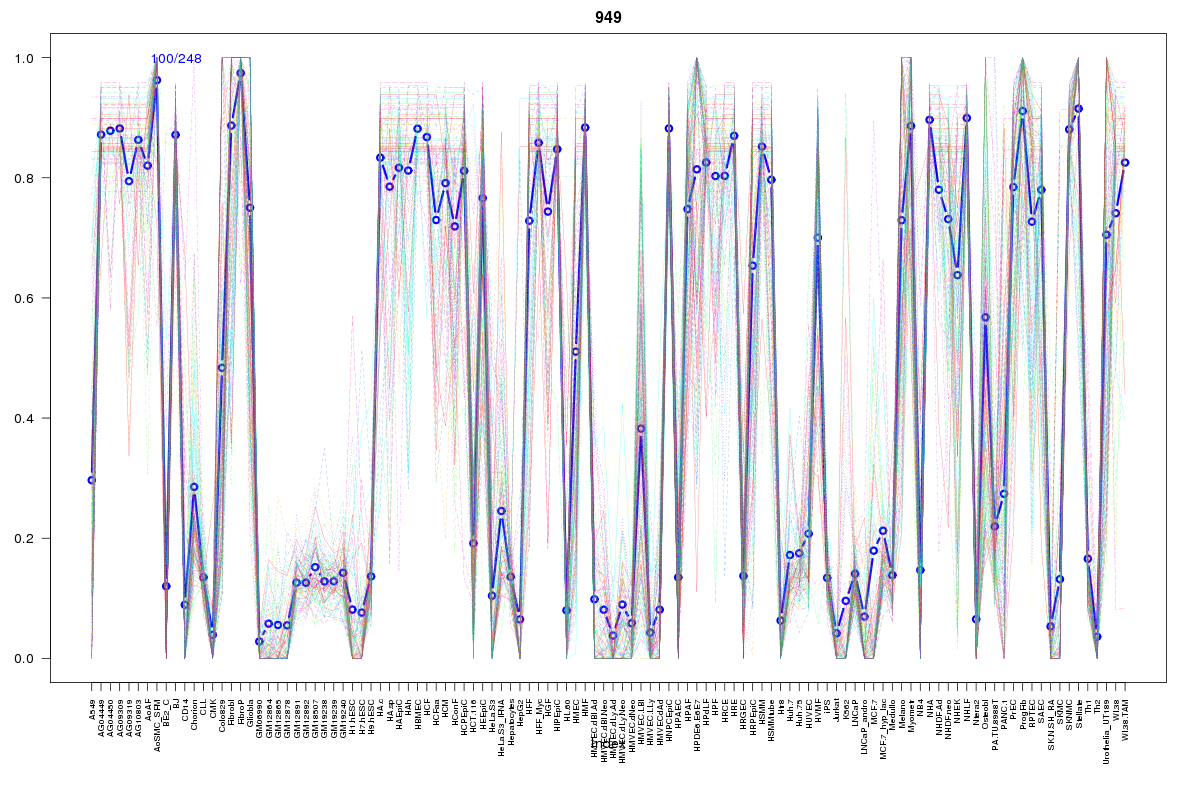
Cluster Hypersensitivity Profile

Genomic Location Trend
These plots show the distribution of the DHS sites surrounding the Transcript Start Site of the nearest gene.
Stats
Number of sites: 248Promoter: 1%
CpG-Island: 0%
Conserved: 52%
Enriched Motifs & Matches
Match Detail: [Jaspar]
|
| ||
|---|---|---|
| Sites: 48/100 | e-val: 0.000000000000099 | ||
| Factor | e-val(match) | DB |
| AP1 | 0.00000000003492 | JASPAR |
| NFE2L2 | 0.0000000081443 | JASPAR |
| PPARG | 0.0054096 | JASPAR |
| NFE2L1::MafG | 0.0073922 | JASPAR |
| PBX1 | 0.012238 | JASPAR |
|
| ||
| Sites: 34/100 | e-val: 0.00011 | ||
| Factor | e-val(match) | DB |
| RUNX1 | 0.00000043992 | JASPAR |
| ZNF354C | 0.000821 | JASPAR |
| RREB1 | 0.0045931 | JASPAR |
| MYC::MAX | 0.013887 | JASPAR |
| FOXO3 | 0.01722 | JASPAR |
BED file downloads
Top 10 Example Regions
| Location | Gene Link | Dist. |
|---|---|---|
| chr1: 92048240-92048390 | CDC7 | 14.33 |
| chr3: 154604340-154604490 | RP11-439C8.2 | 40.1 |
| chr3: 21759760-21759910 | ZNF385D | 44.06 |
| chr18: 56234800-56234950 | ALPK2 | 44.66 |
| chr7: 134378140-134378290 | CALD1 | 47.95 |
| chr11: 72484500-72484650 | ATG16L2 | 48.53 |
| chr11: 72484500-72484650 | ARAP1-AS2 | 48.53 |
| chr7: 30208900-30209050 | MTURN | 56.92 |
| chr17: 13465500-13465650 | HS3ST3A1 | 57.53 |
| chr9: 124318980-124319130 | RN7SL187P | 59.3 |