SOM cluster: 950
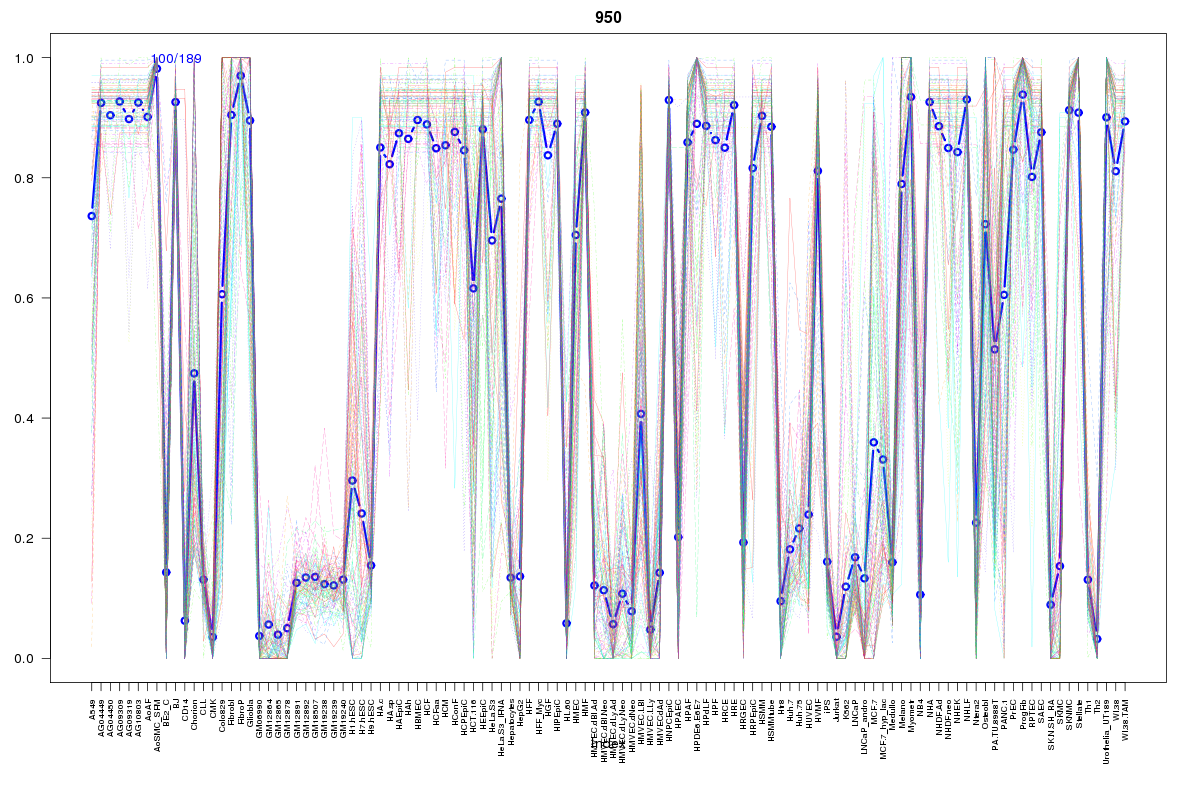
Cluster Hypersensitivity Profile

Genomic Location Trend
These plots show the distribution of the DHS sites surrounding the Transcript Start Site of the nearest gene.
Stats
Number of sites: 189Promoter: 5%
CpG-Island: 1%
Conserved: 50%
Enriched Motifs & Matches
Match Detail: [Jaspar]
|
| ||
|---|---|---|
| Sites: 58/100 | e-val: 1.9e-29 | ||
| Factor | e-val(match) | DB |
| AP1 | 0.00000000097026 | JASPAR |
| NFE2L2 | 0.00000069705 | JASPAR |
| PPARG | 0.0020689 | JASPAR |
| NFE2L1::MafG | 0.014619 | JASPAR |
| RORA_2 | 0.03366 | JASPAR |
BED file downloads
Top 10 Example Regions
| Location | Gene Link | Dist. |
|---|---|---|
| chr3: 138109280-138109430 | MRAS | 49.43 |
| chr1: 151509700-151509850 | TUFT1 | 50.68 |
| chr1: 151509700-151509850 | POGZ | 50.68 |
| chr1: 151509700-151509850 | SNORA44 | 50.68 |
| chr3: 32010540-32010690 | OSBPL10 | 51.72 |
| chr8: 22508500-22508650 | SORBS3 | 52.95 |
| chr8: 22508500-22508650 | C8orf58 | 52.95 |
| chr8: 22508500-22508650 | PDLIM2 | 52.95 |
| chr8: 22508500-22508650 | AC037459.4 | 52.95 |
| chr8: 22508500-22508650 | PEBP4 | 52.95 |