SOM cluster: 989
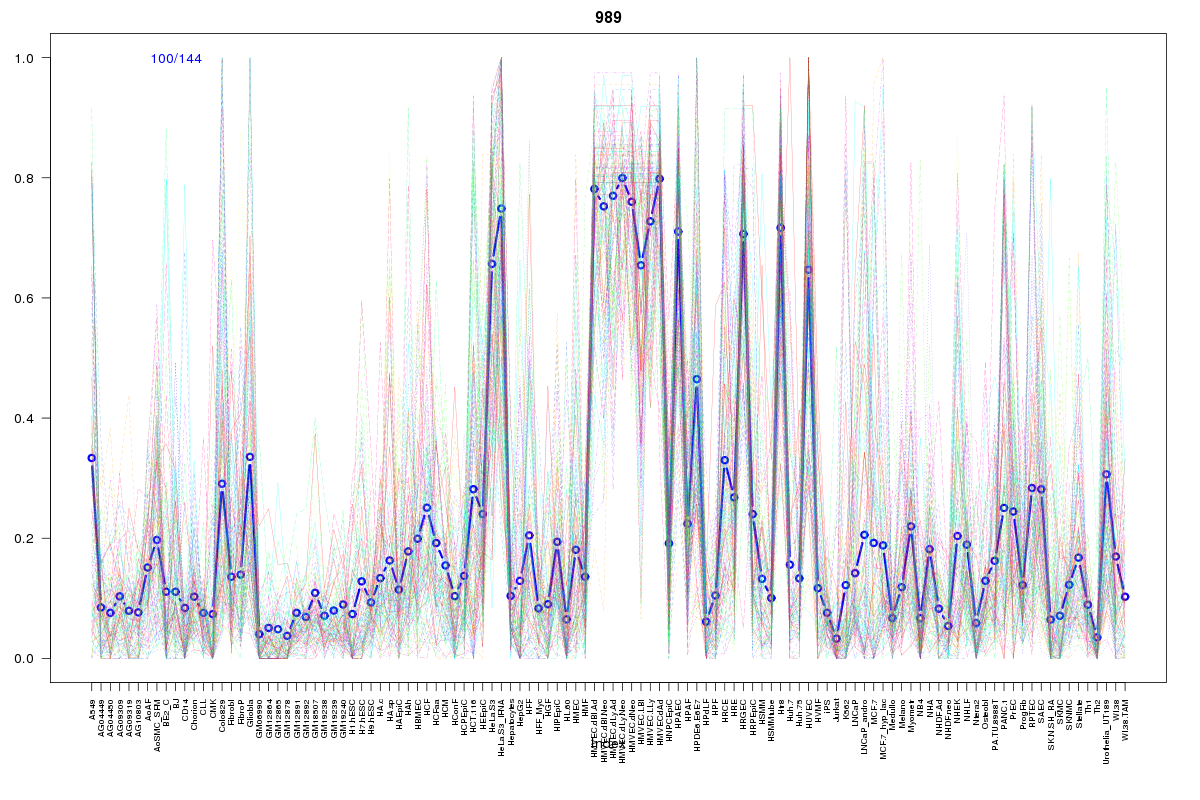
Cluster Hypersensitivity Profile

Genomic Location Trend
These plots show the distribution of the DHS sites surrounding the Transcript Start Site of the nearest gene.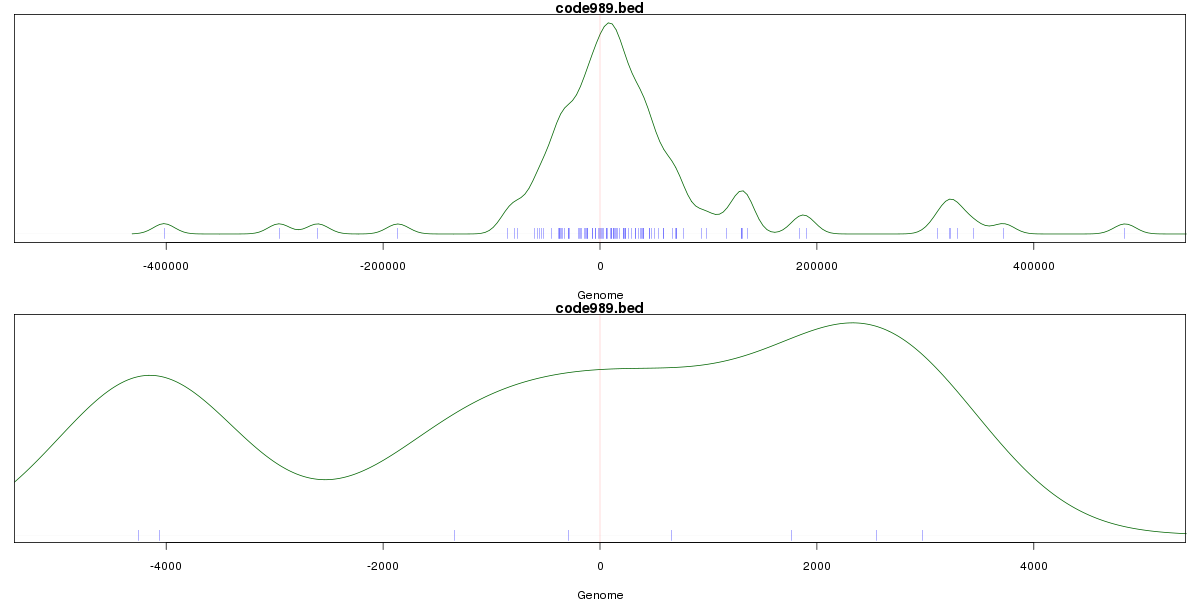
Stats
Number of sites: 144Promoter: 2%
CpG-Island: 0%
Conserved: 46%
Enriched Motifs & Matches
Match Detail: [Jaspar]
|
| ||
|---|---|---|
| Sites: 47/100 | e-val: 0.000000051 | ||
| Factor | e-val(match) | DB |
| FEV | 0.0000000050383 | JASPAR |
| SPI1 | 0.00000019485 | JASPAR |
| EWSR1-FLI1 | 0.0000025954 | JASPAR |
| ELF5 | 0.000021837 | JASPAR |
| ELK4 | 0.000026997 | JASPAR |
|
| ||
| Sites: 37/100 | e-val: 0.00001 | ||
| Factor | e-val(match) | DB |
| AP1 | 0.00000048932 | JASPAR |
| NFE2L2 | 0.0000016591 | JASPAR |
| Pdx1 | 0.001004 | JASPAR |
| HOXA5 | 0.0017916 | JASPAR |
| NFE2L1::MafG | 0.0079014 | JASPAR |