SOM cluster: 993
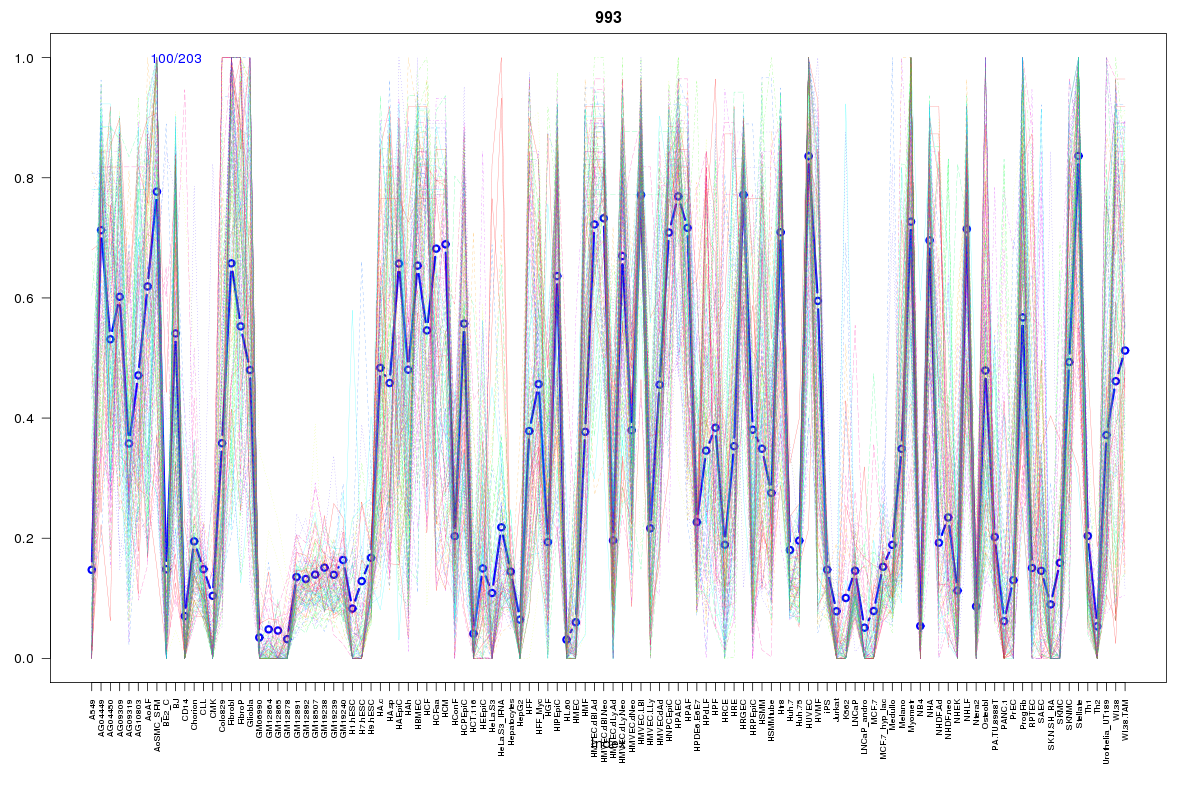
Cluster Hypersensitivity Profile

Genomic Location Trend
These plots show the distribution of the DHS sites surrounding the Transcript Start Site of the nearest gene.
Stats
Number of sites: 203Promoter: 0%
CpG-Island: 0%
Conserved: 42%
Enriched Motifs & Matches
Match Detail: [Jaspar]
|
| ||
|---|---|---|
| Sites: 28/100 | e-val: 0.000000093 | ||
| Factor | e-val(match) | DB |
| NFE2L2 | 0.0000000000073237 | JASPAR |
| AP1 | 0.000000020198 | JASPAR |
| RORA_1 | 0.0044423 | JASPAR |
| PPARG | 0.012614 | JASPAR |
| NR4A2 | 0.016765 | JASPAR |
BED file downloads
Top 10 Example Regions
| Location | Gene Link | Dist. |
|---|---|---|
| chr15: 89192465-89192615 | MIR7-2 | 49.61 |
| chr15: 89192465-89192615 | RP11-97O12.2 | 49.61 |
| chr5: 110899160-110899310 | NREP | 53.37 |
| chr13: 45458640-45458790 | NUFIP1 | 53.67 |
| chr8: 101635580-101635730 | ANKRD46 | 54.02 |
| chr8: 101635580-101635730 | GAPDHP62 | 54.02 |
| chrX: 118789180-118789330 | CXorf56 | 56.84 |
| chrX: 118789180-118789330 | NKRF | 56.84 |
| chr3: 120157900-120158050 | LRRC58 | 57.16 |
| chr3: 120157900-120158050 | FSTL1 | 57.16 |