SOM cluster: 998
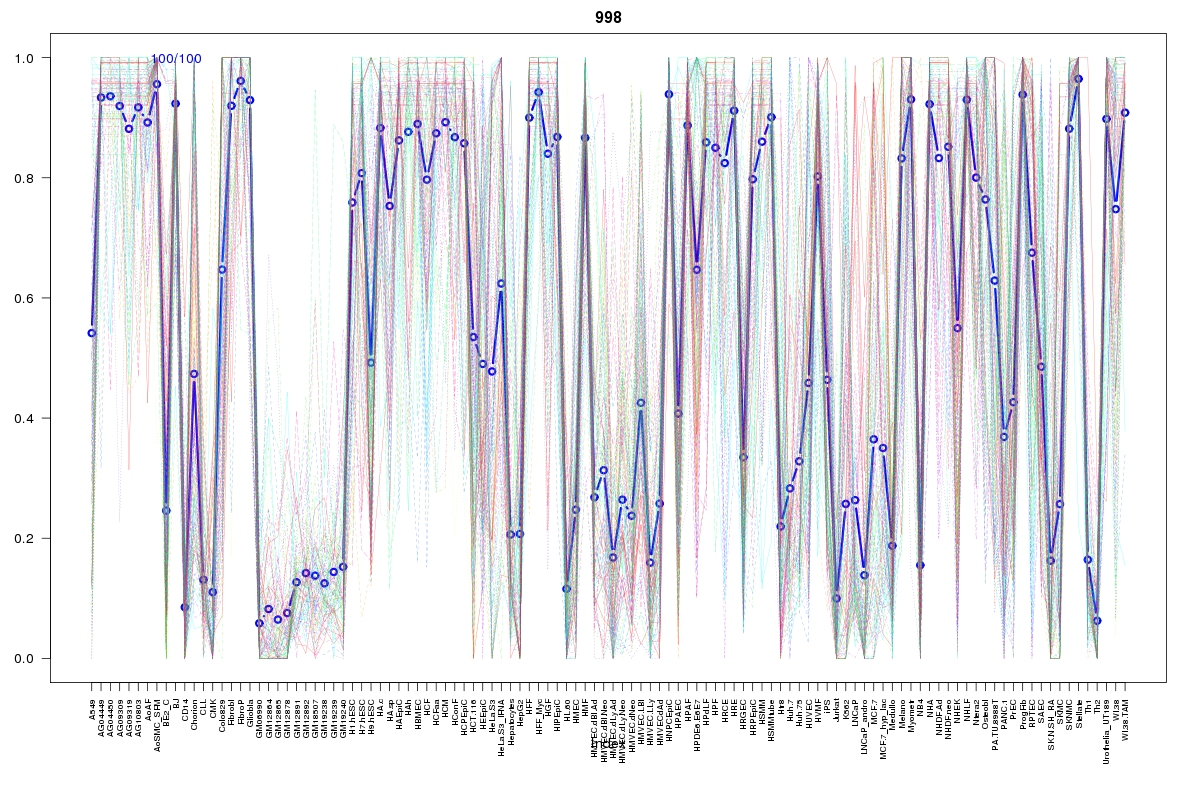
Cluster Hypersensitivity Profile

Genomic Location Trend
These plots show the distribution of the DHS sites surrounding the Transcript Start Site of the nearest gene.
Stats
Number of sites: 100Promoter: 7%
CpG-Island: 1%
Conserved: 66%
Enriched Motifs & Matches
Match Detail: [Jaspar]
|
| ||
|---|---|---|
| Sites: 47/100 | e-val: 3.5e-19 | ||
| Factor | e-val(match) | DB |
| SP1 | 0.00000030989 | JASPAR |
| RREB1 | 0.00000042497 | JASPAR |
| Pax4 | 0.0000046872 | JASPAR |
| Tal1::Gata1 | 0.000023486 | JASPAR |
| Klf4 | 0.00010458 | JASPAR |
|
| ||
| Sites: 38/100 | e-val: 1.2e-16 | ||
| Factor | e-val(match) | DB |
| AP1 | 0.00000000062005 | JASPAR |
| NFE2L2 | 0.0000010417 | JASPAR |
| PBX1 | 0.0088984 | JASPAR |
| NFE2L1::MafG | 0.013605 | JASPAR |
| PPARG | 0.031376 | JASPAR |
|
| ||
| Sites: 19/100 | e-val: 0.000043 | ||
| Factor | e-val(match) | DB |
| RELA | 0.0007459 | JASPAR |
| NF-kappaB | 0.0015161 | JASPAR |
| TEAD1 | 0.0028293 | JASPAR |
| NFKB1 | 0.0072543 | JASPAR |
| znf143 | 0.0093327 | JASPAR |
BED file downloads
Top 10 Example Regions
| Location | Gene Link | Dist. |
|---|---|---|
| chr2: 100630420-100630570 | AFF3 | 47.72 |
| chr8: 38770260-38770410 | ADAM9 | 49.7 |
| chr8: 38770260-38770410 | RP11-723D22.3 | 49.7 |
| chr8: 38770260-38770410 | TM2D2 | 49.7 |
| chr1: 160176245-160176395 | RP11-536C5.7 | 50.33 |
| chr1: 160176245-160176395 | COPA | 50.33 |
| chr1: 160176245-160176395 | PEA15 | 50.33 |
| chr13: 40139840-40139990 | COG6 | 57.66 |
| chr13: 40139840-40139990 | LHFP | 57.66 |
| chr13: 114864860-114865010 | RASA3 | 59.85 |