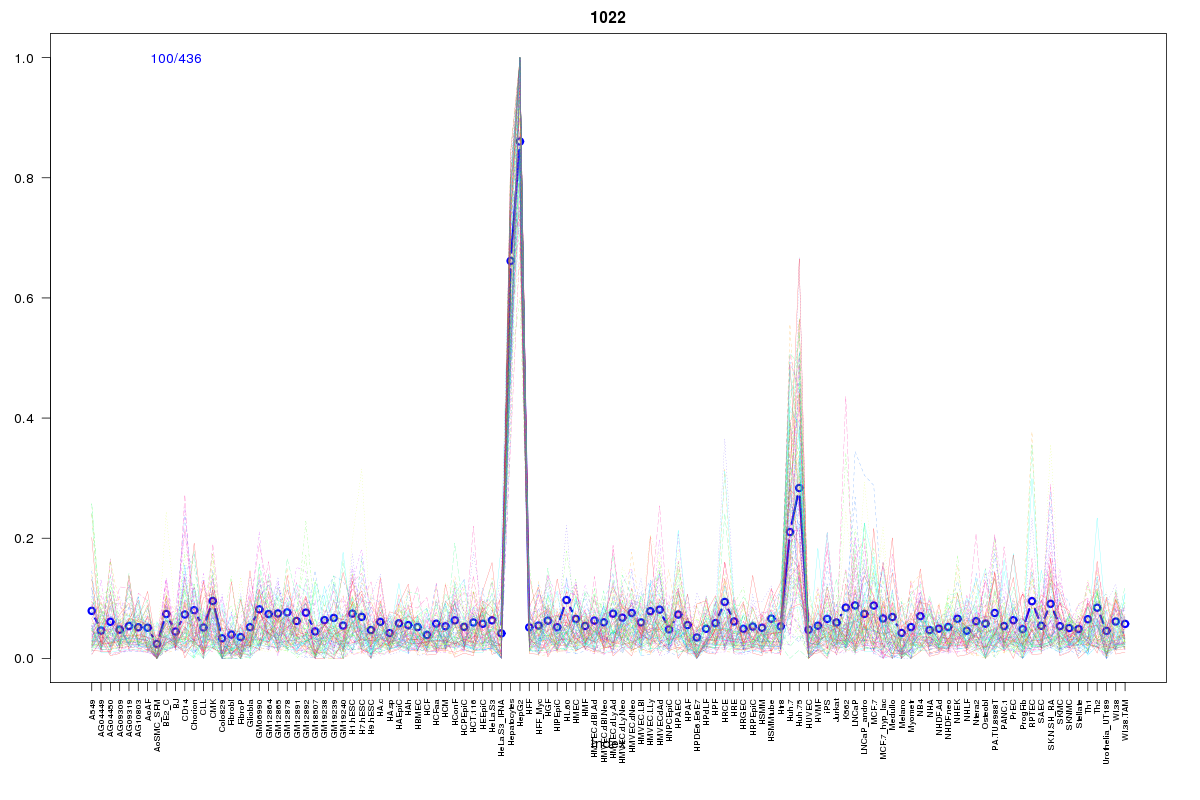
SOM cluster: 1022
Cluster Hypersensitivity Profile

Genomic Location Trend
These plots show the distribution of the DHS sites surrounding the Transcript Start Site of the nearest gene.
Stats
Number of sites: 436Promoter: 18%
CpG-Island: 0%
Conserved: 42%
Enriched Motifs & Matches
Match Detail: [Jaspar]
|
| ||
|---|---|---|
| Sites: 54/100 | e-val: 6.3e-21 | ||
| Factor | e-val(match) | DB |
| HNF4A | 0.0000000000000031086 | JASPAR |
| NR2F1 | 0.00000000023043 | JASPAR |
| PPARG::RXRA | 0.0000018443 | JASPAR |
| NR1H2::RXRA | 0.0000091556 | JASPAR |
| NFIC | 0.00070857 | JASPAR |
|
| ||
| Sites: 37/100 | e-val: 0.000000065 | ||
| Factor | e-val(match) | DB |
| SP1 | 0.000048416 | JASPAR |
| Myf | 0.00089742 | JASPAR |
| Tal1::Gata1 | 0.0023387 | JASPAR |
| Klf4 | 0.0027698 | JASPAR |
| RXR::RAR_DR5 | 0.0029375 | JASPAR |
|
| ||
| Sites: 19/100 | e-val: 0.00017 | ||
| Factor | e-val(match) | DB |
| EWSR1-FLI1 | 0.00000000000050238 | JASPAR |
| SP1 | 0.0000038335 | JASPAR |
| Pax4 | 0.000074487 | JASPAR |
| znf143 | 0.00041376 | JASPAR |
| RREB1 | 0.0033264 | JASPAR |
BED file downloads
Top 10 Example Regions
| Location | Gene Link | Dist. |
|---|---|---|
| chr21: 47575480-47575630 | FTCD | 48.11 |
| chr11: 2003620-2003770 | MRPL23-AS1 | 51.62 |
| chr1: 1103245-1103395 | MIR200A | 54.96 |
| chr1: 1103245-1103395 | RNF223 | 54.96 |
| chr1: 161193380-161193530 | NR1I3 | 56.33 |
| chr1: 161193380-161193530 | APOA2 | 56.33 |
| chr1: 161193380-161193530 | MPZ | 56.33 |
| chr9: 34630460-34630610 | ARID3C | 60.73 |
| chr9: 34630460-34630610 | GALT | 60.73 |
| chr11: 118979725-118979875 | CBL | 61.01 |