Gene: NR1I3
chr1: 161199455-161208000Expression Profile
(log scale)
Graphical Connections
Distribution of linked clusters:
You may find it interesting if many of the connected DHS sites belong to the same cluster.| Cluster Profile | Cluster ID | Number of DHS sites in this cluster |
|---|---|---|
 | 927 | 10 |
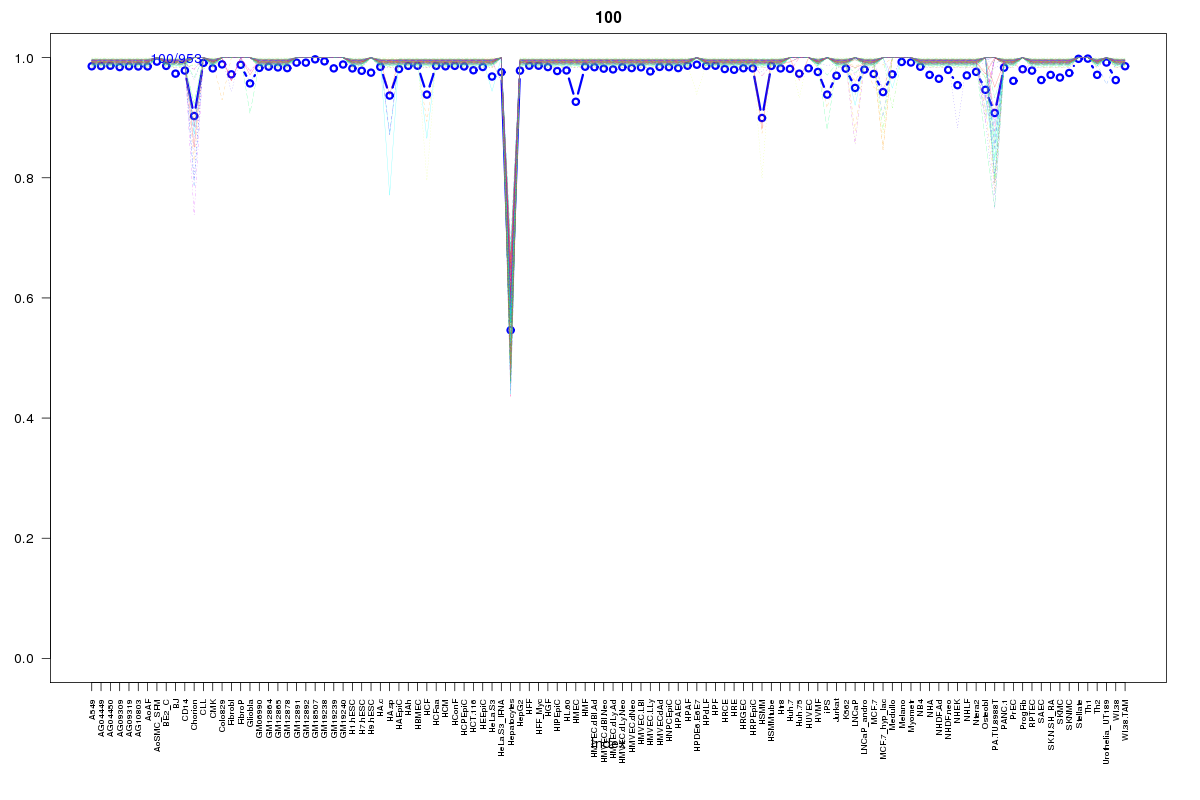 | 100 | 3 |
 | 978 | 2 |
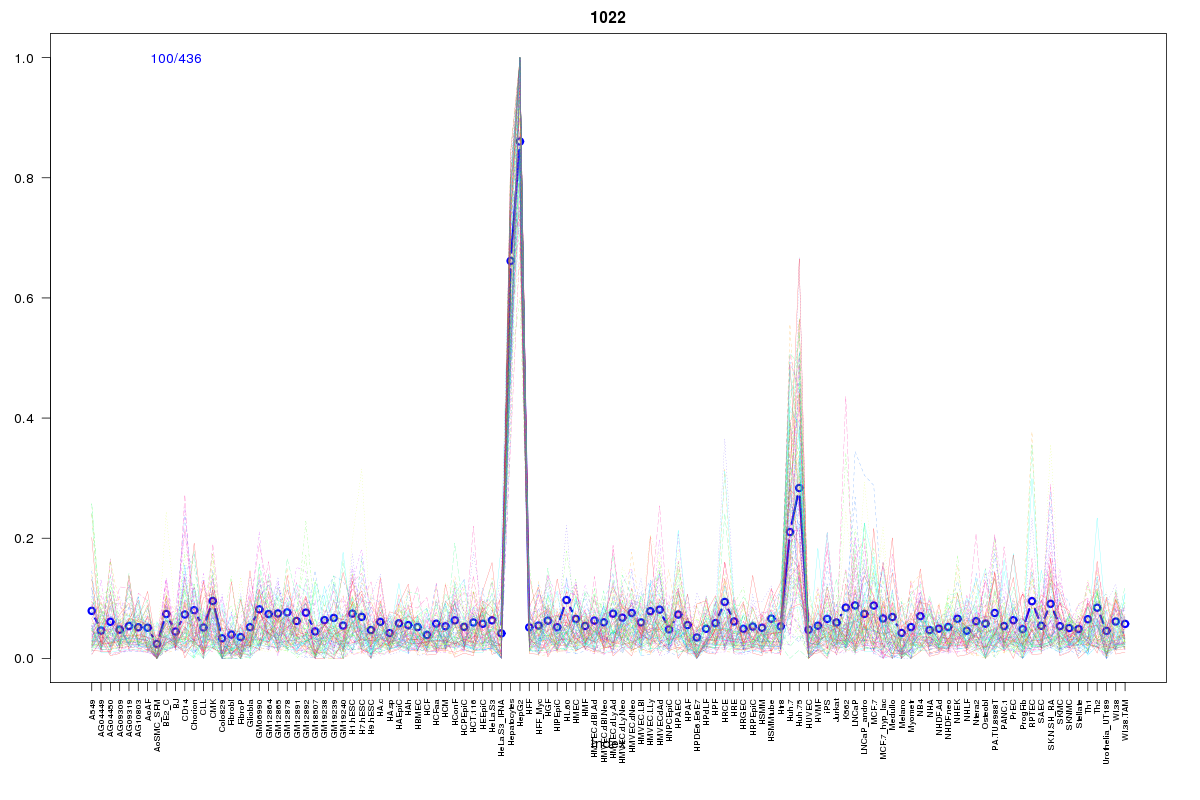 | 1022 | 2 |
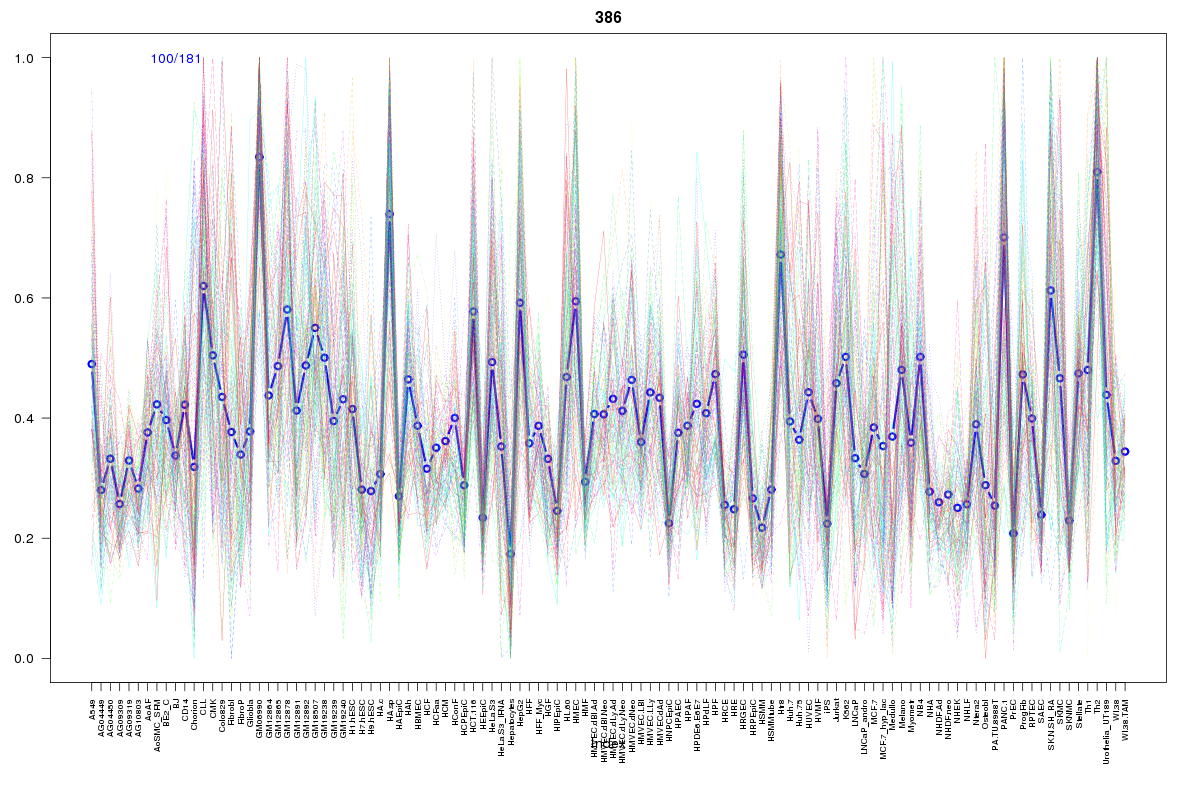 | 386 | 2 |
 | 860 | 2 |
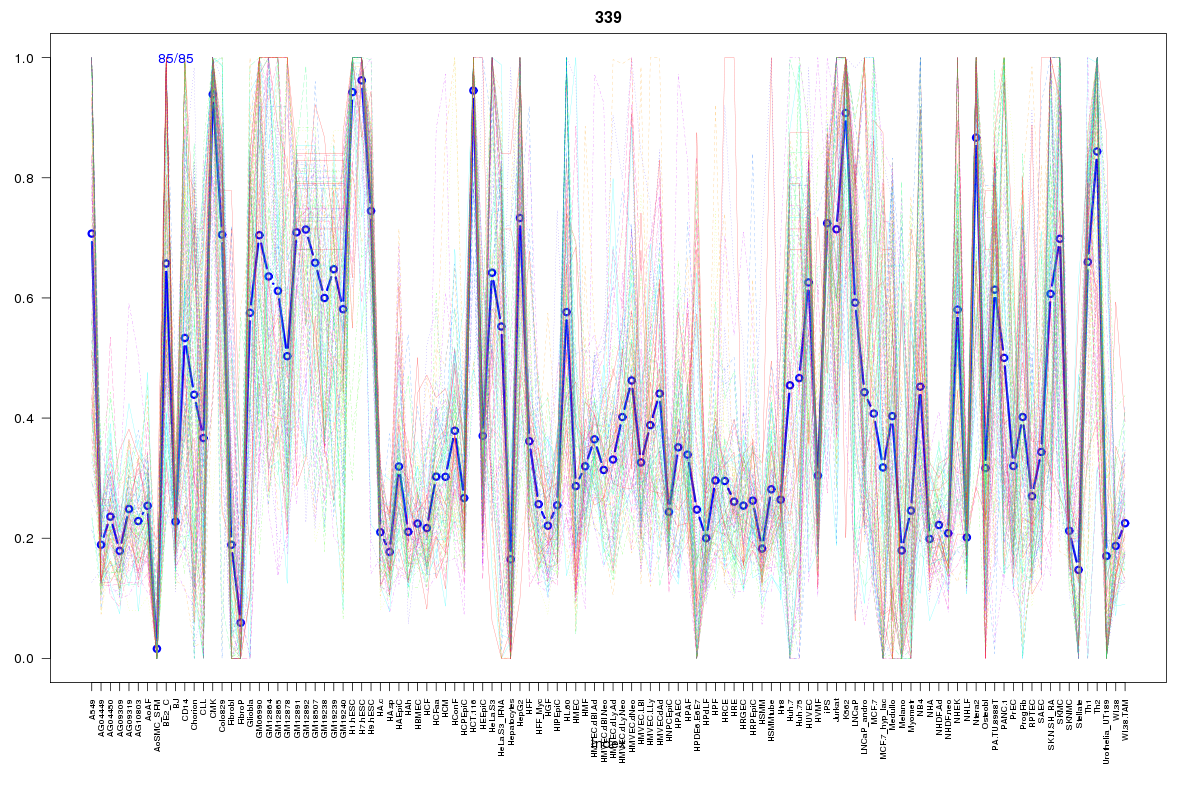 | 339 | 1 |
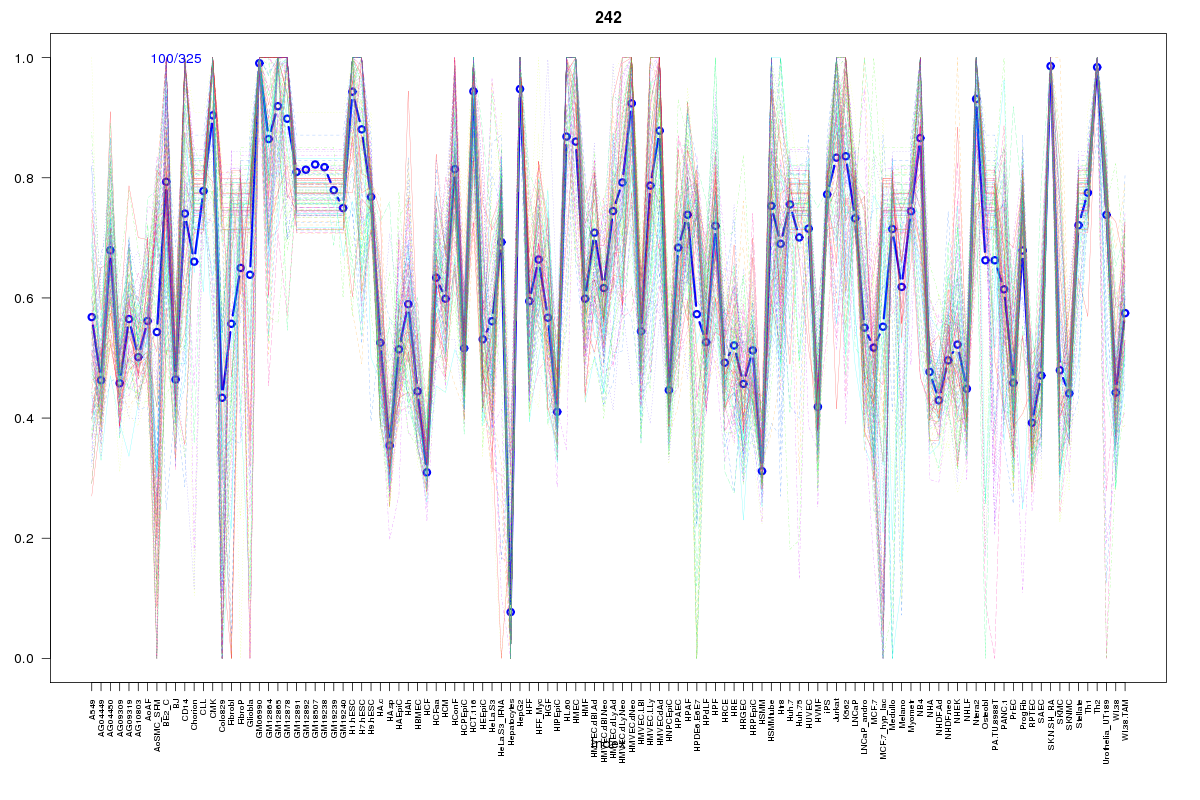 | 242 | 1 |
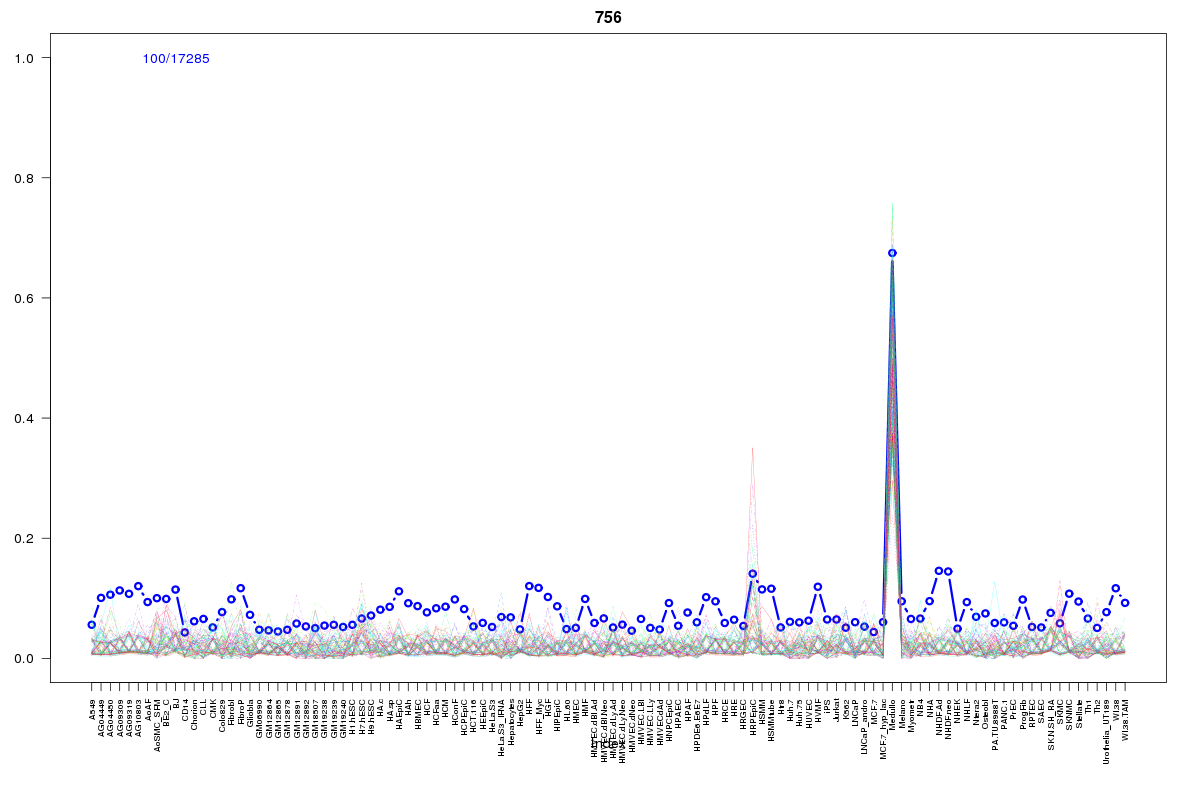 | 756 | 1 |
 | 615 | 1 |
 | 934 | 1 |
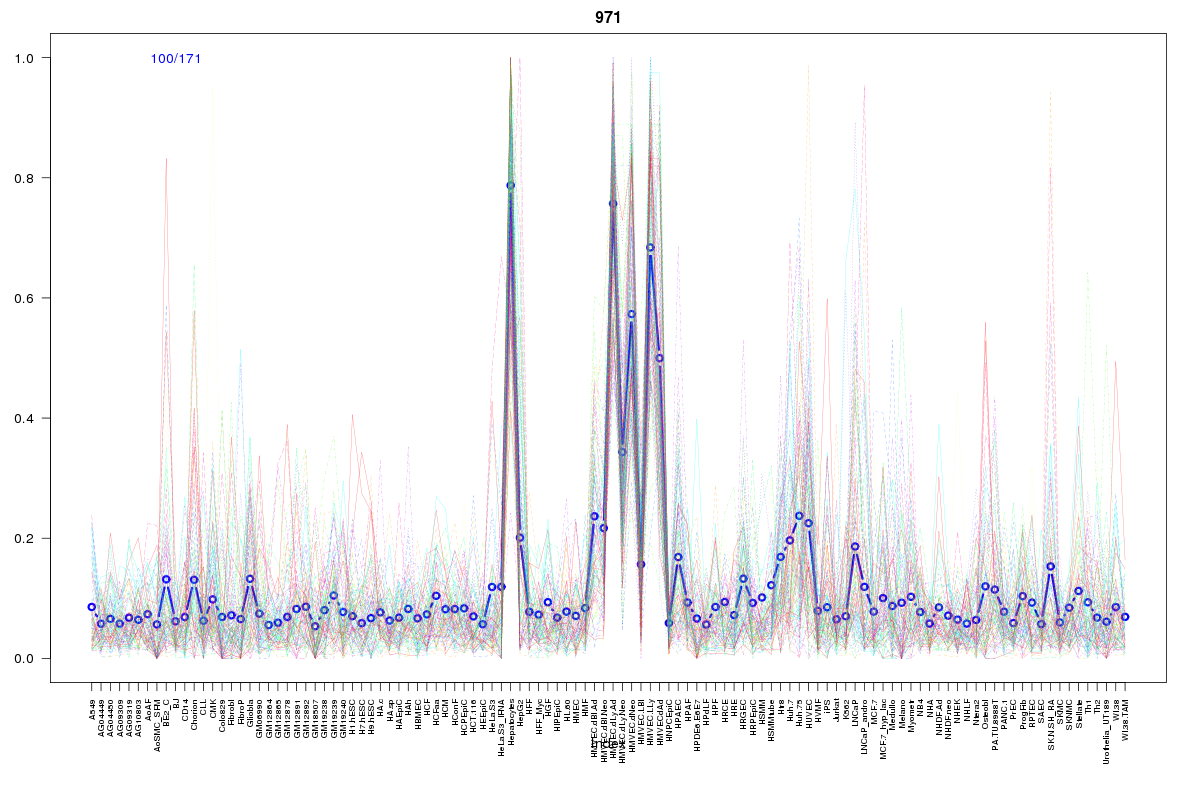 | 971 | 1 |
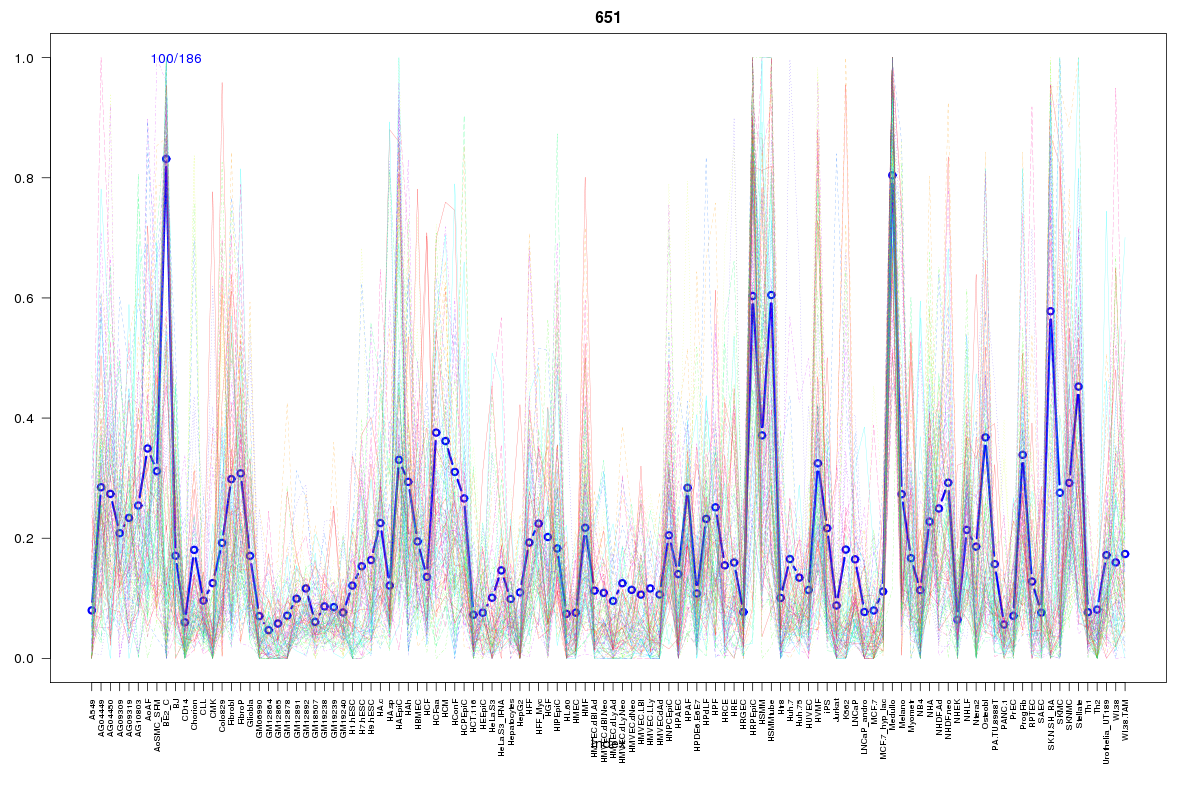 | 651 | 1 |
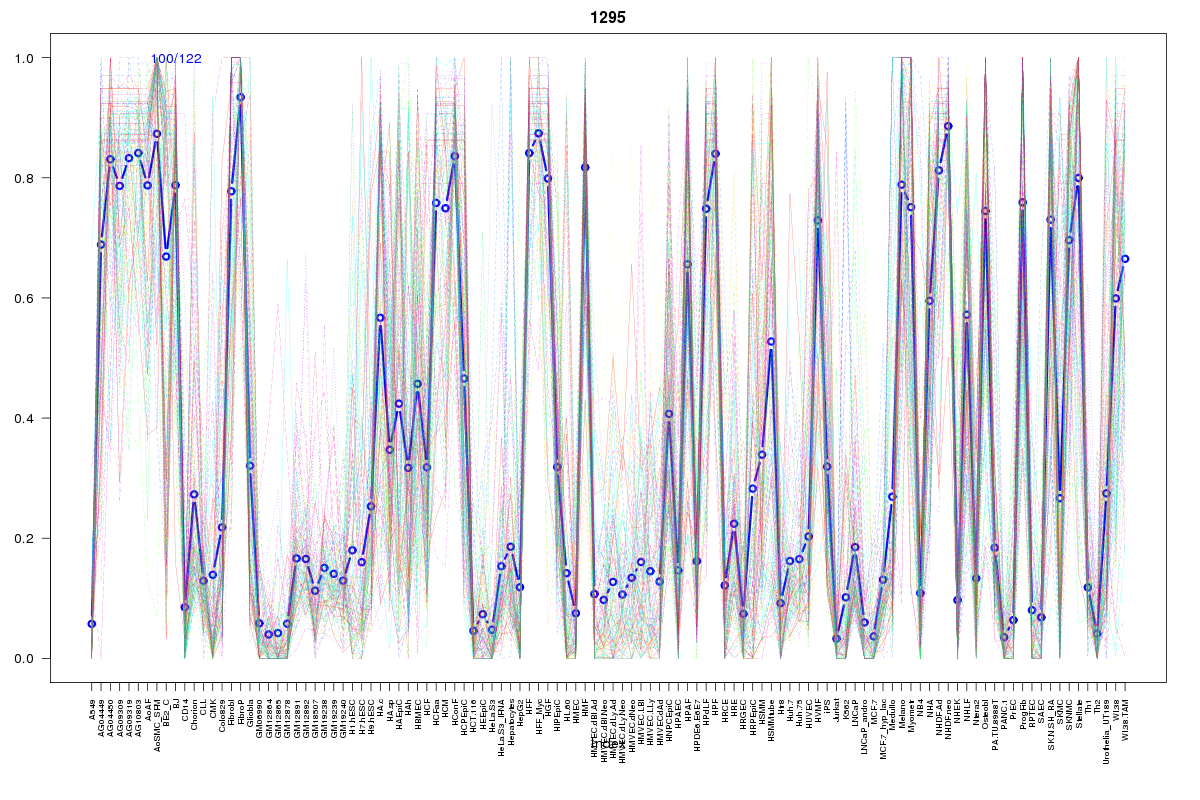 | 1295 | 1 |
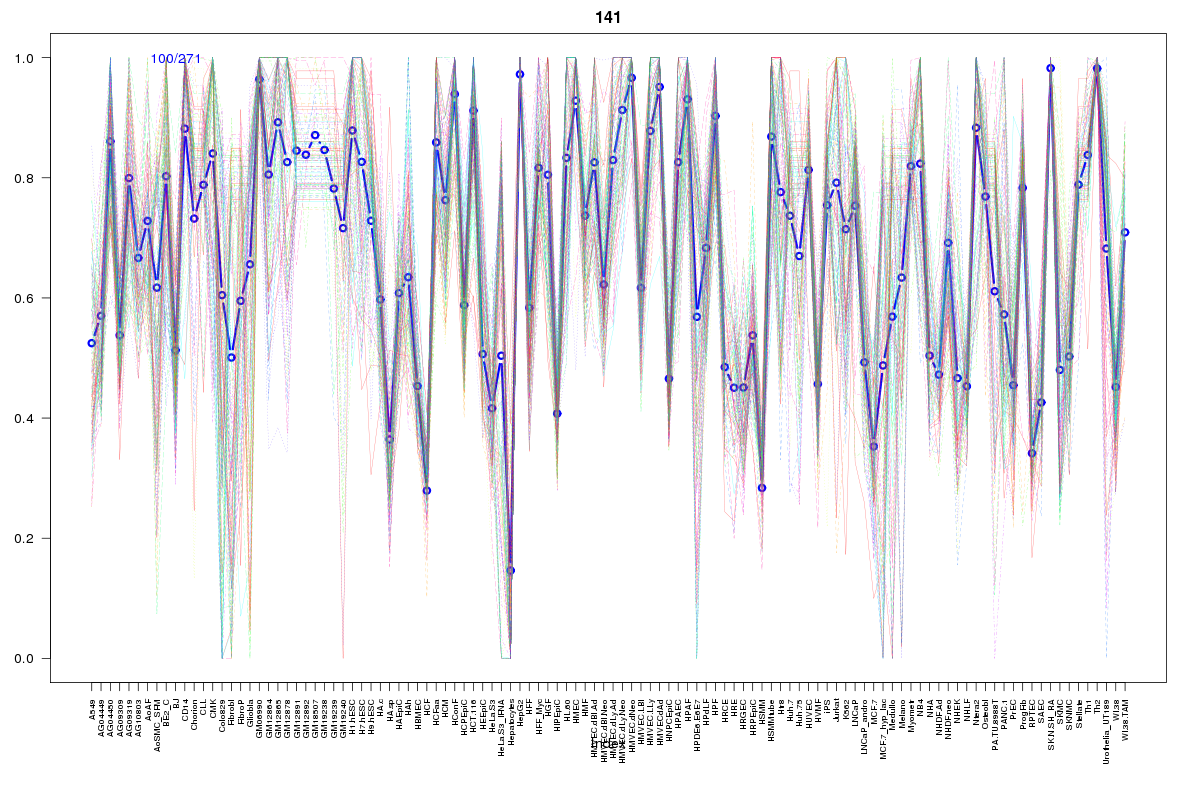 | 141 | 1 |
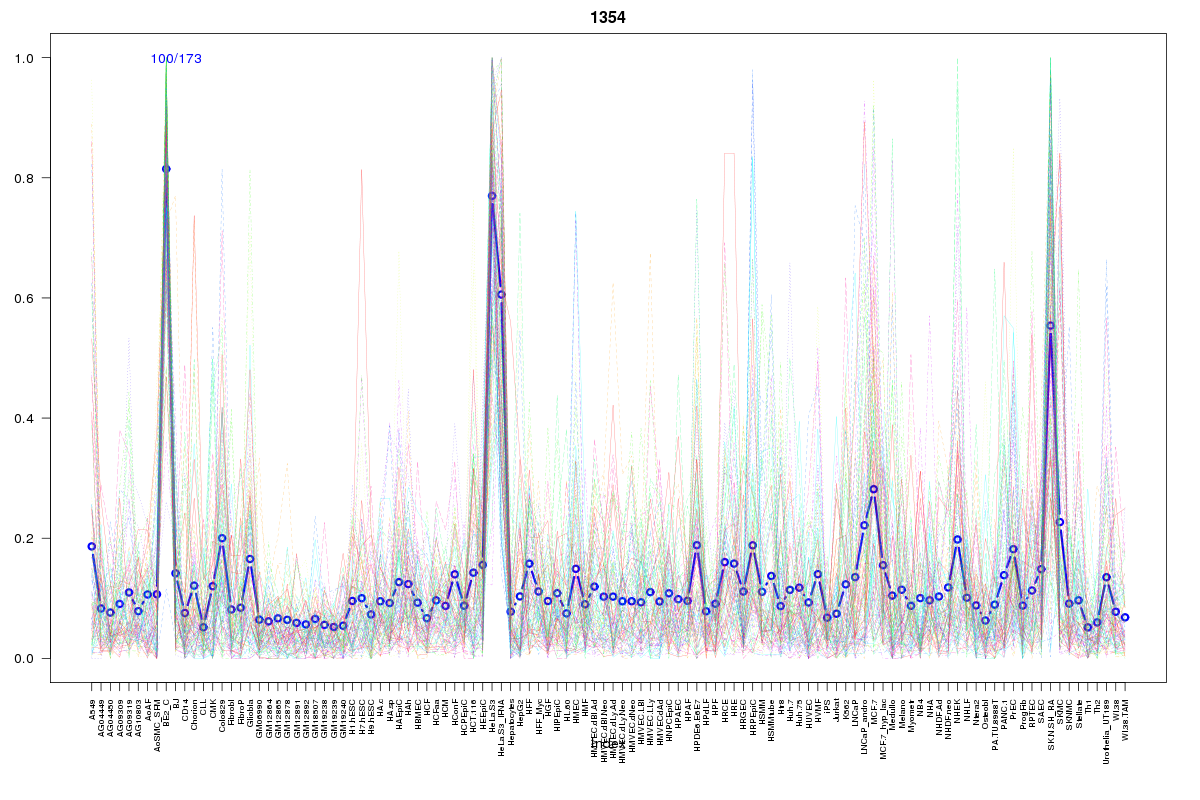 | 1354 | 1 |
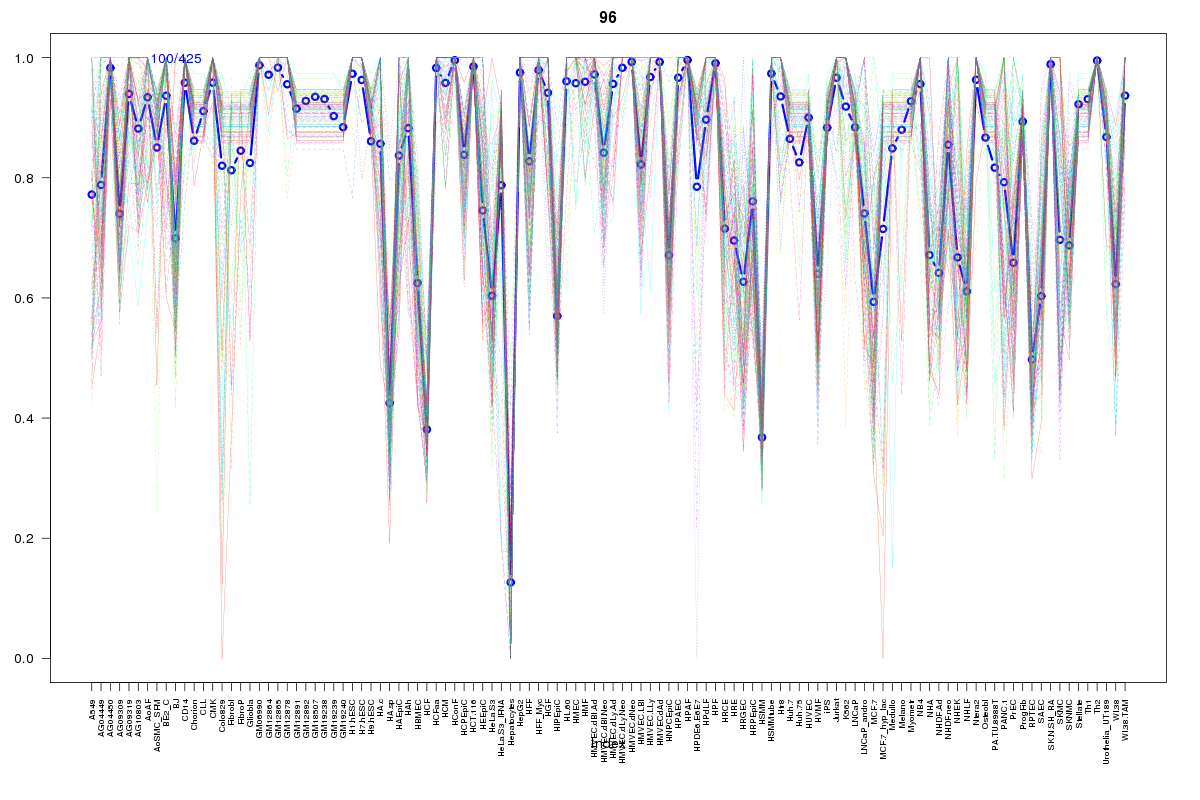 | 96 | 1 |
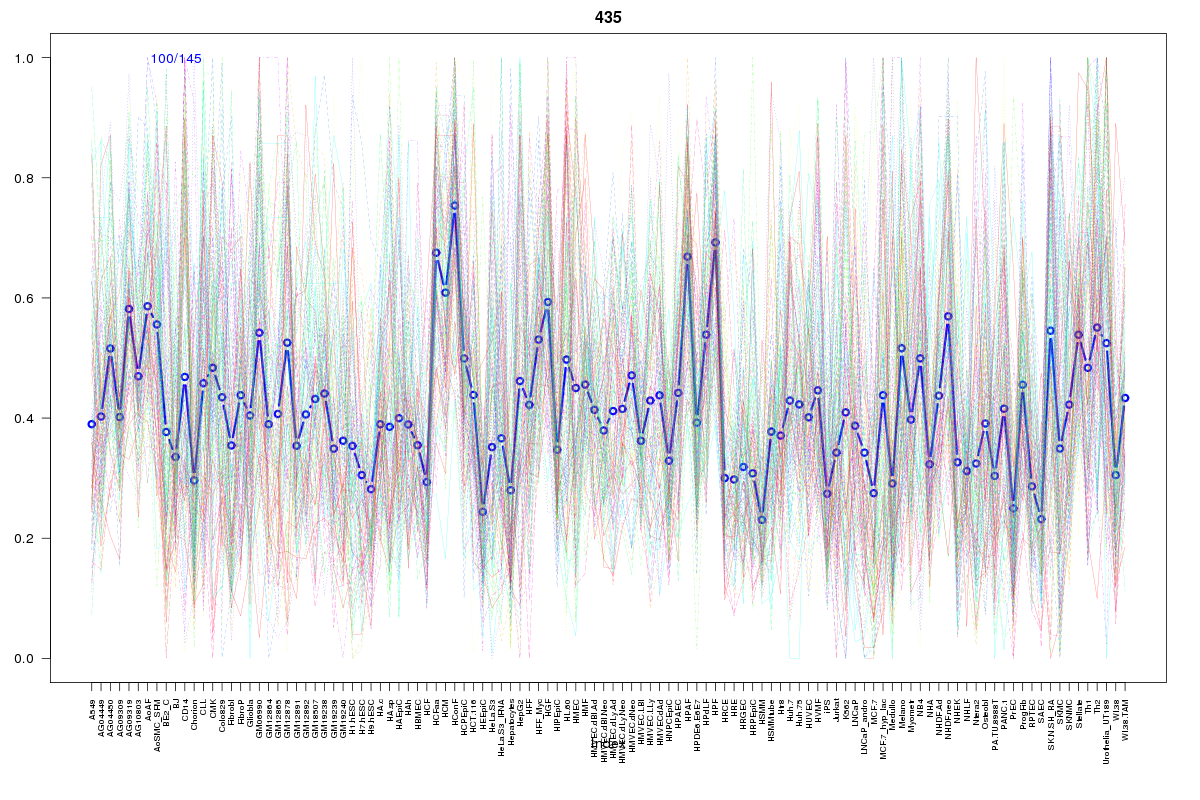 | 435 | 1 |
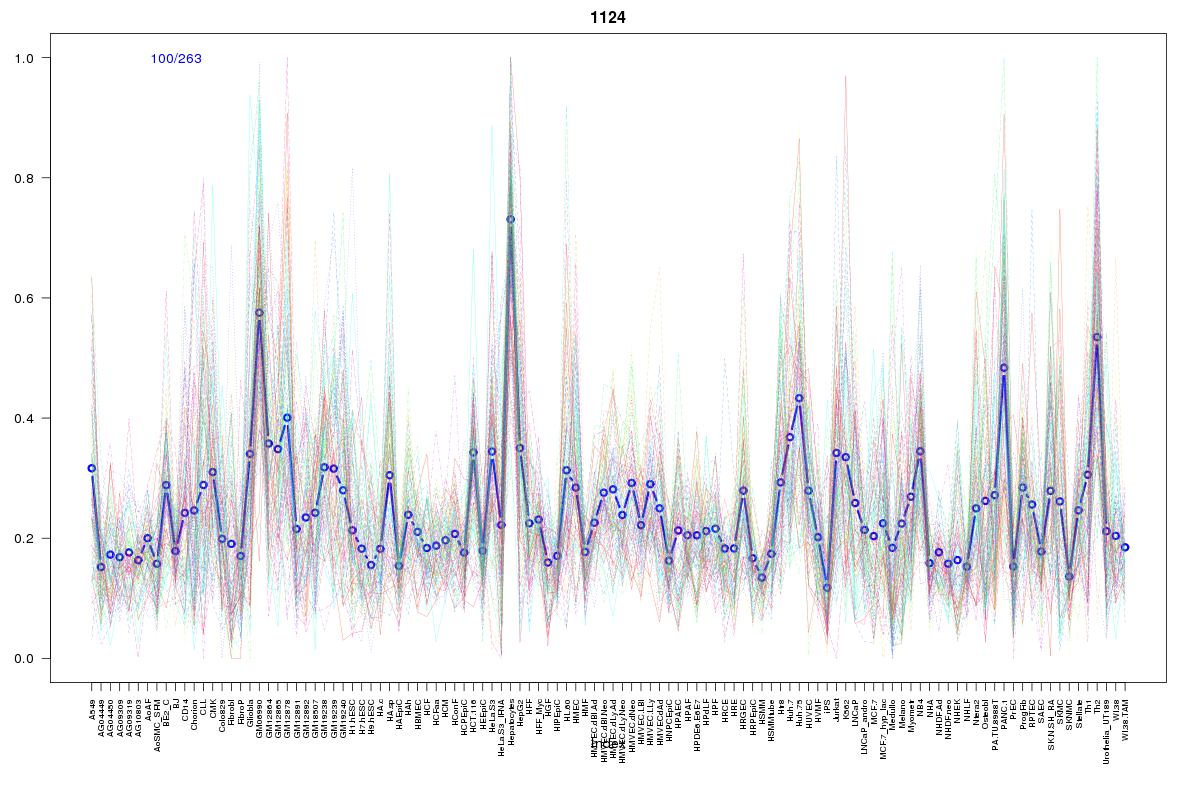 | 1124 | 1 |
 | 2055 | 1 |
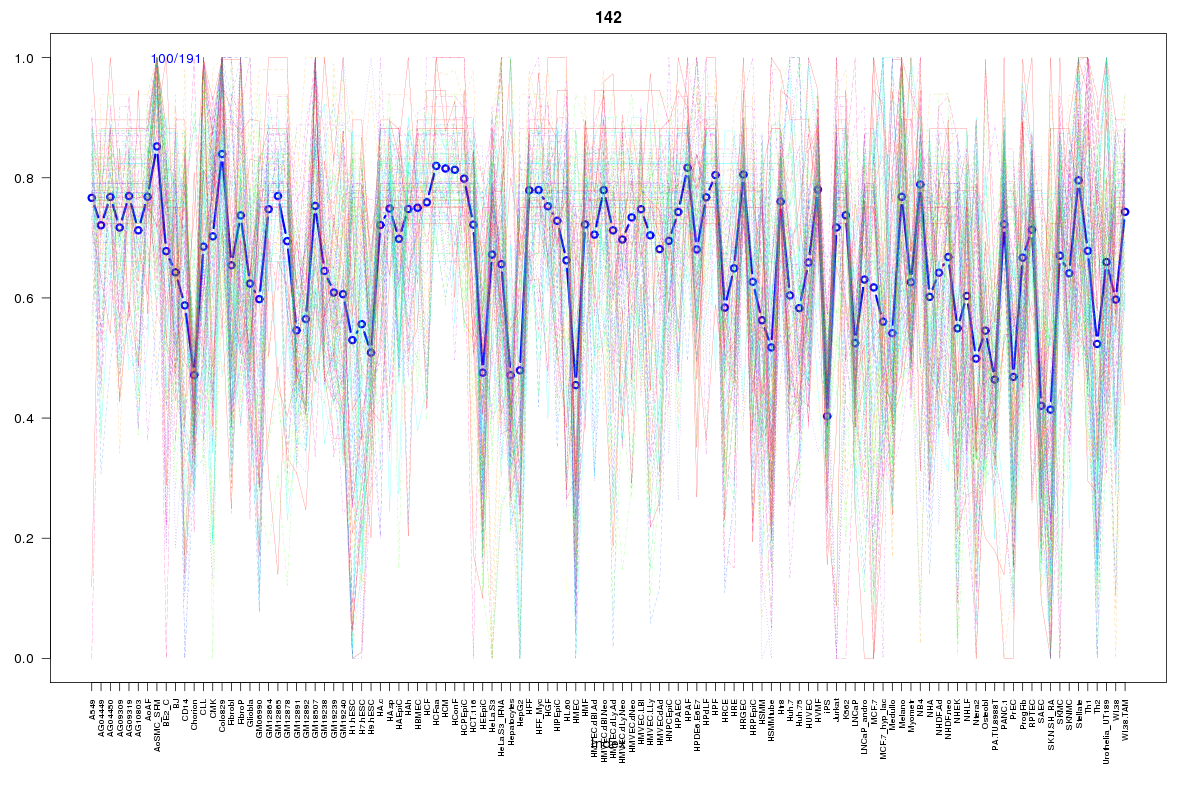 | 142 | 1 |
 | 430 | 1 |
 | 1605 | 1 |
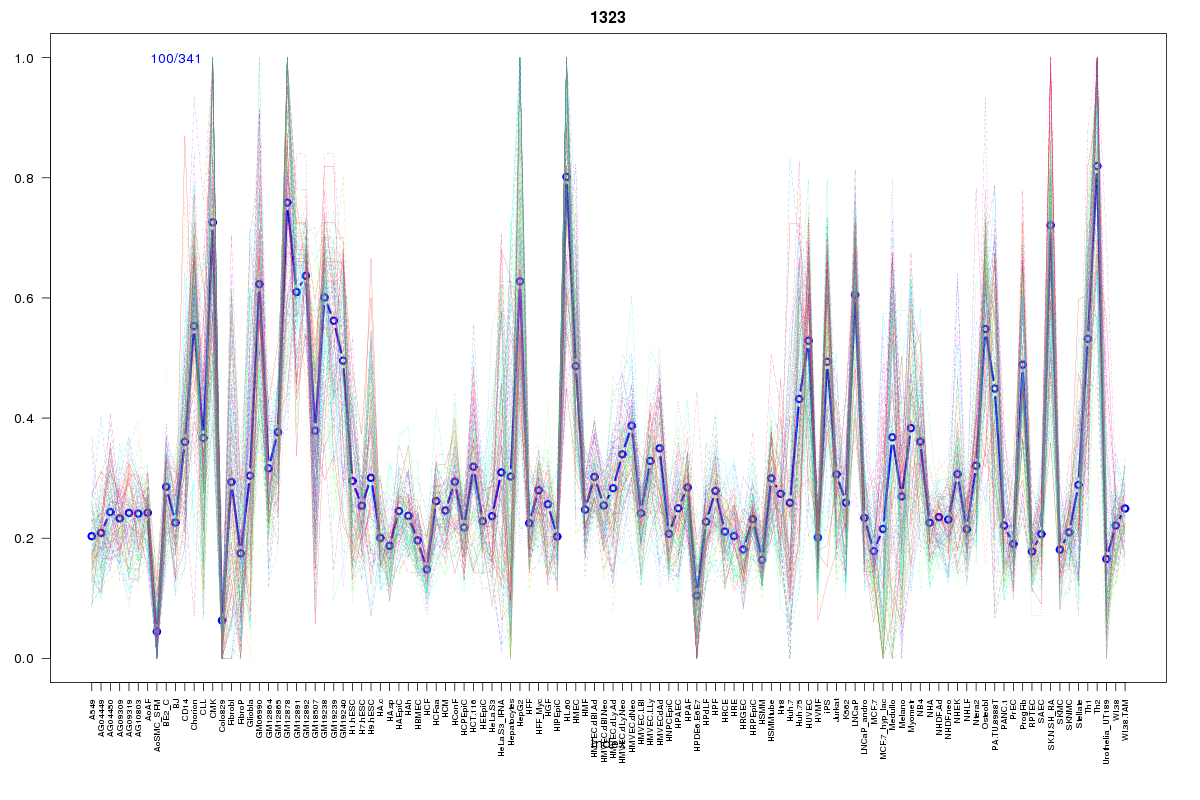 | 1323 | 1 |
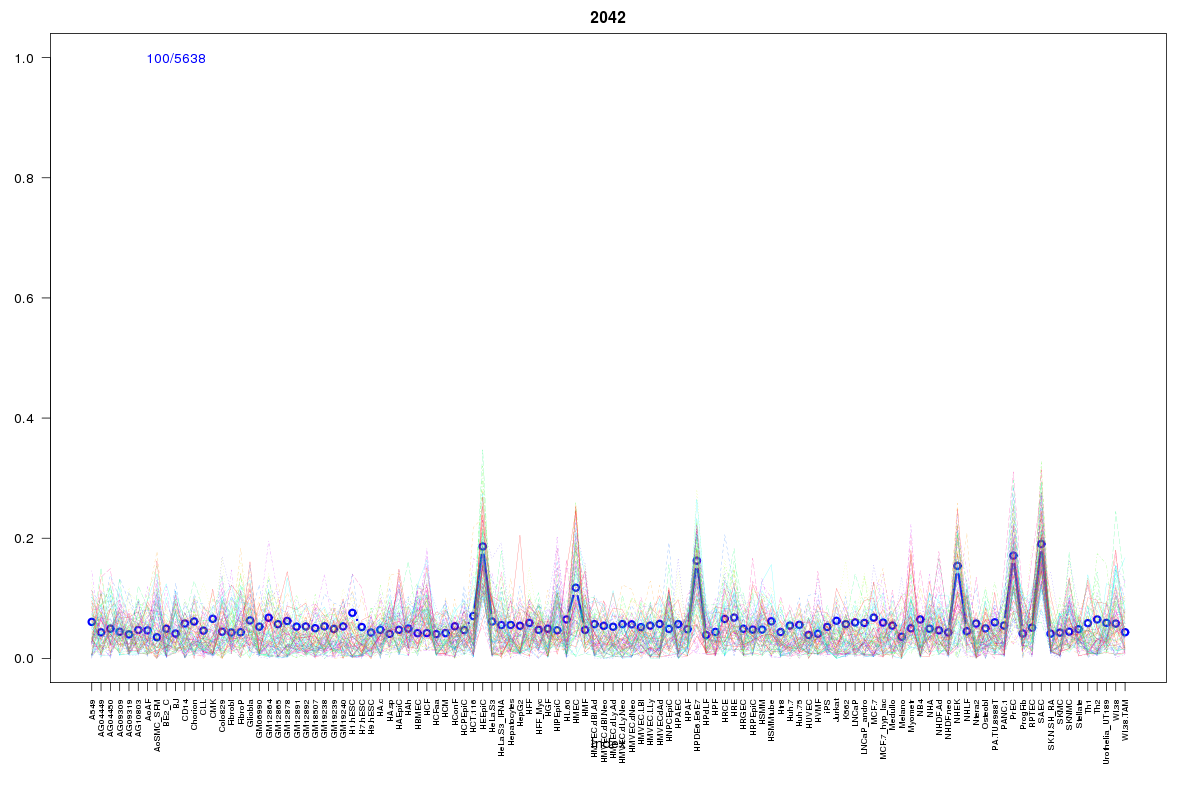 | 2042 | 1 |
 | 604 | 1 |
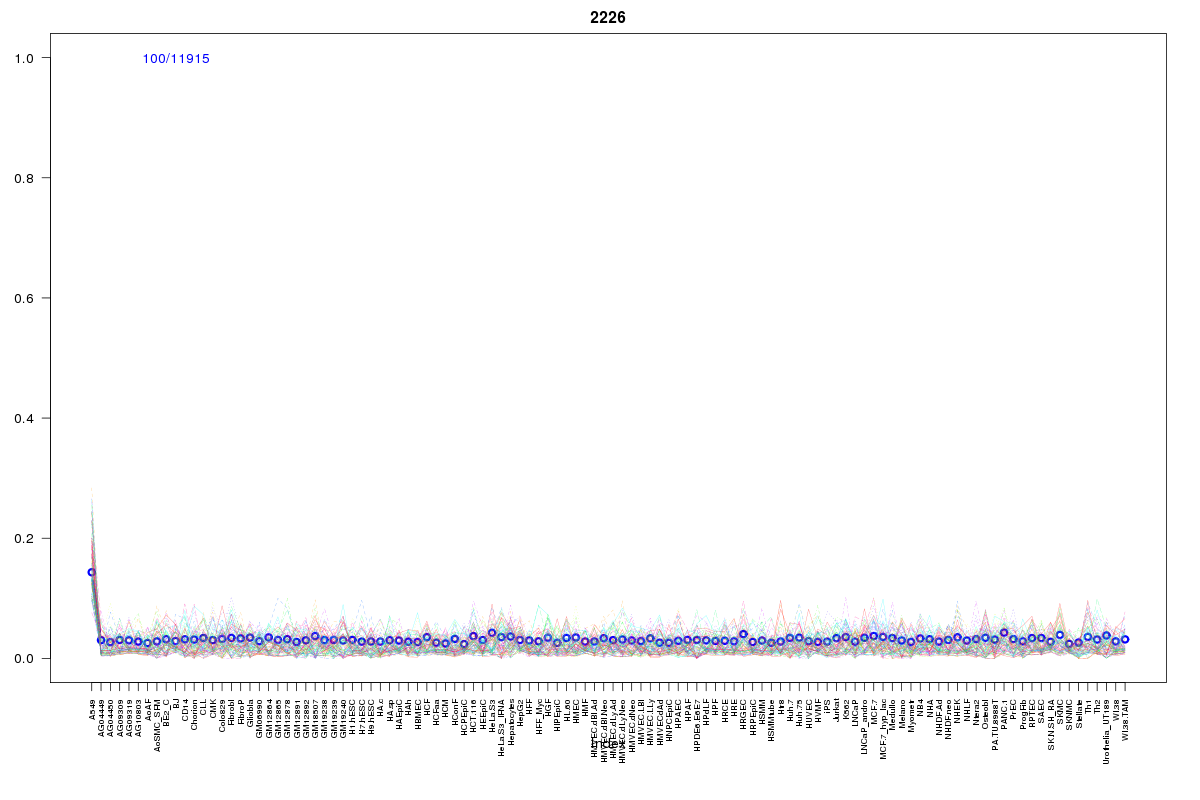 | 2226 | 1 |
 | 194 | 1 |
 | 569 | 1 |
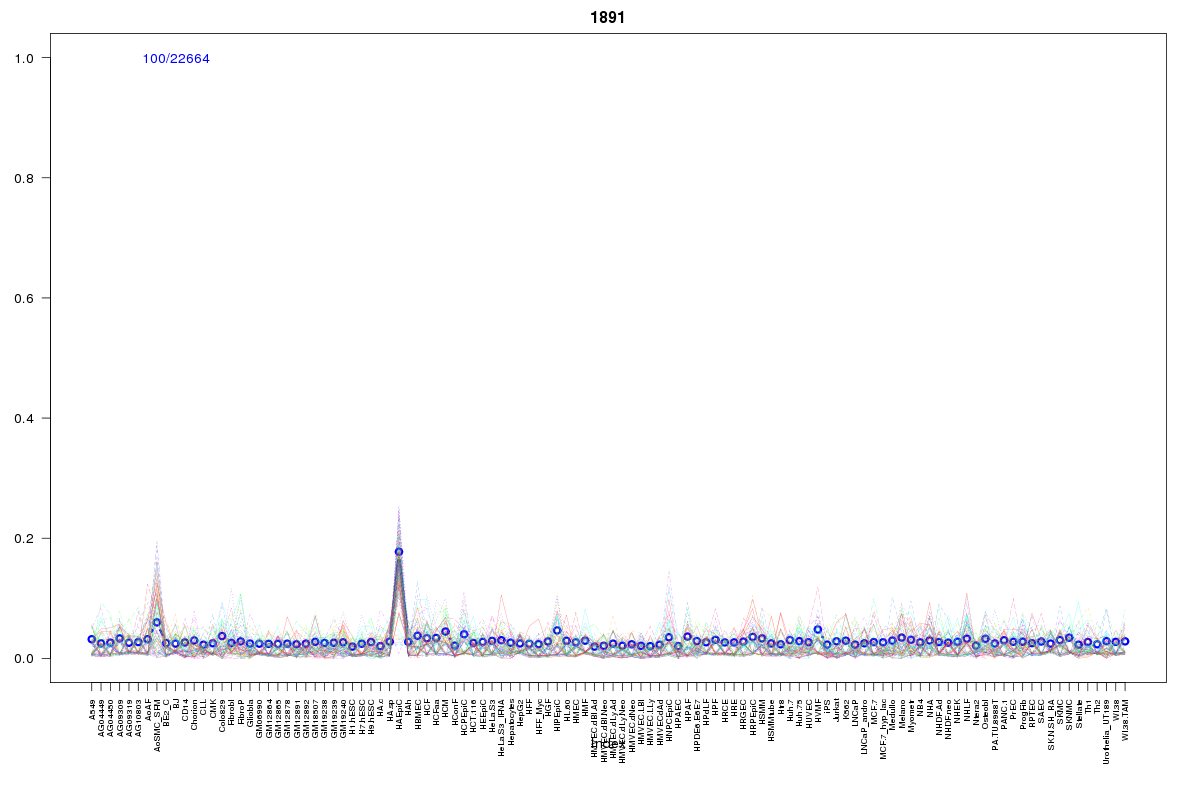 | 1891 | 1 |
Resources
BED file downloads
Connects to 45 DHS sitesTop 10 Correlated DHS Sites
p-values indiciate significant higher or lower correlation| Location | Cluster | P-value |
|---|---|---|
| chr1:161107325-161107475 | 927 | 0 |
| chr1:161127205-161127355 | 927 | 0.003 |
| chr1:161100885-161101035 | 927 | 0.004 |
| chr1:161229565-161229715 | 927 | 0.004 |
| chr1:161134305-161134455 | 927 | 0.006 |
| chr1:161108960-161109110 | 927 | 0.007 |
| chr1:161173085-161173235 | 927 | 0.009 |
| chr1:161108200-161108350 | 2055 | 0.013 |
| chr1:161145365-161145515 | 569 | 0.013 |
| chr1:161105925-161106075 | 927 | 0.014 |
| chr1:161101580-161101730 | 978 | 0.017 |
External Databases
UCSCEnsembl (ENSG00000143257)