SOM cluster: 1074
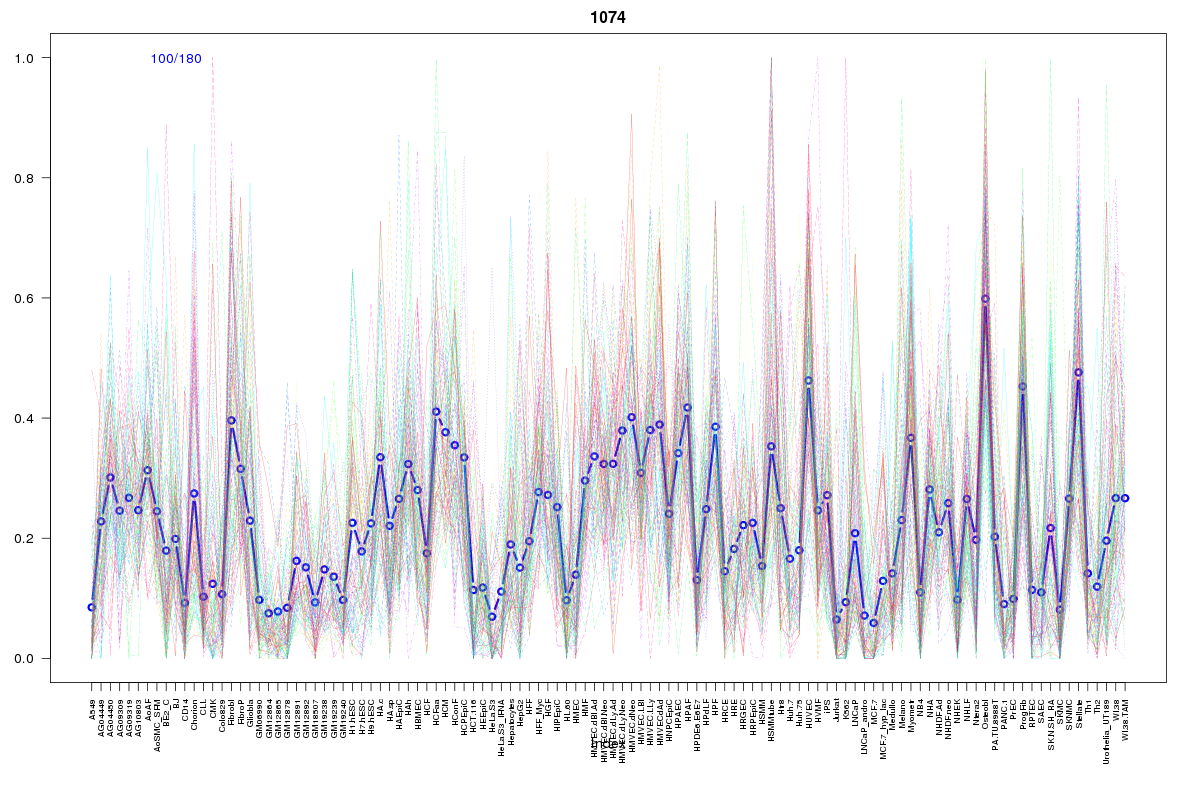
Cluster Hypersensitivity Profile

Genomic Location Trend
These plots show the distribution of the DHS sites surrounding the Transcript Start Site of the nearest gene.
Stats
Number of sites: 180Promoter: 15%
CpG-Island: 36%
Conserved: 48%
Enriched Motifs & Matches
Match Detail: [Jaspar]
|
| ||
|---|---|---|
| Sites: 83/100 | e-val: 2.4e-25 | ||
| Factor | e-val(match) | DB |
| SP1 | 0.000000093989 | JASPAR |
| Egr1 | 0.0017511 | JASPAR |
| Klf4 | 0.023362 | JASPAR |
| MZF1_1-4 | 0.046634 | JASPAR |
| Pax4 | 0.04742 | JASPAR |
BED file downloads
Top 10 Example Regions
| Location | Gene Link | Dist. |
|---|---|---|
| chr15: 96903045-96903195 | NR2F2 | 37.61 |
| chr15: 96903045-96903195 | RP11-522B15.3 | 37.61 |
| chr15: 96903045-96903195 | RP11-522B15.6 | 37.61 |
| chr12: 106642225-106642375 | CKAP4 | 42.16 |
| chrX: 100914860-100915010 | ARMCX2 | 59.03 |
| chrX: 100914860-100915010 | ARMCX6 | 59.03 |
| chr3: 129315465-129315615 | H1FOO | 59.8 |
| chr3: 129315465-129315615 | PLXND1 | 59.8 |
| chr16: 86600660-86600810 | FOXC2 | 62.18 |
| chr7: 2321300-2321450 | MAD1L1 | 63.57 |