SOM cluster: 1297
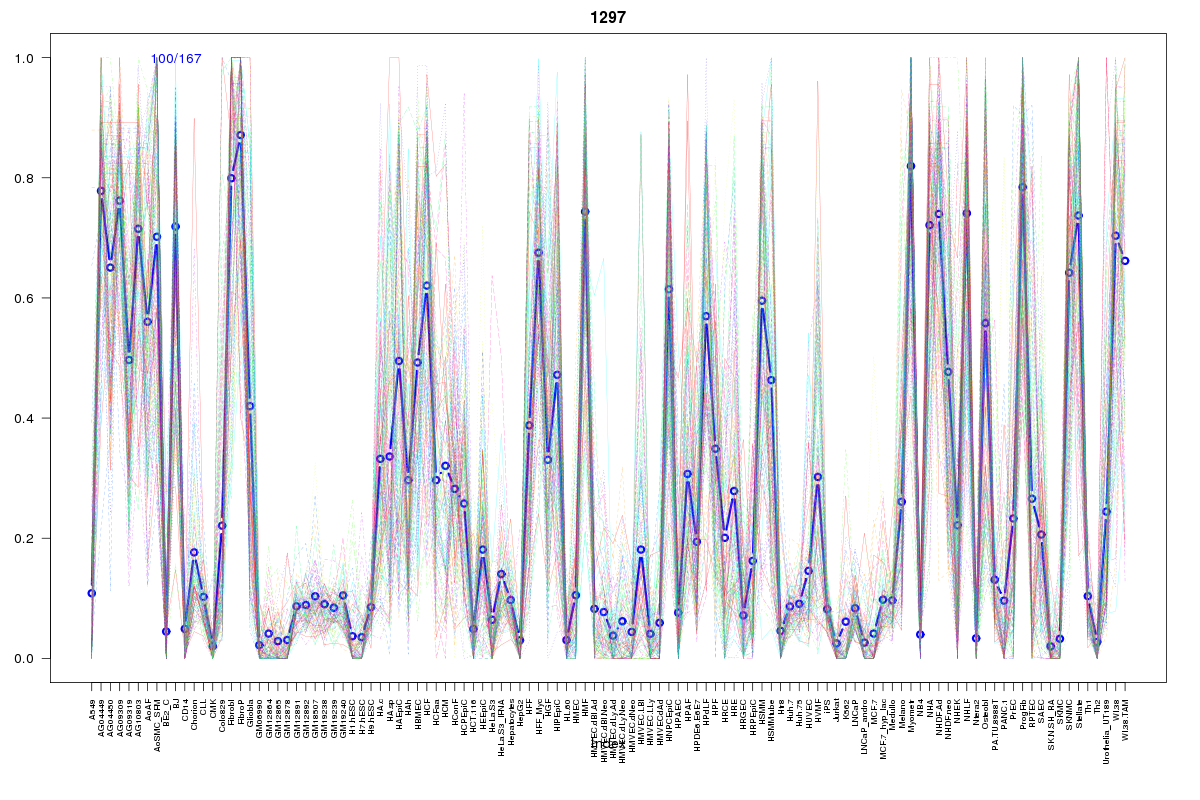
Cluster Hypersensitivity Profile

Genomic Location Trend
These plots show the distribution of the DHS sites surrounding the Transcript Start Site of the nearest gene.
Stats
Number of sites: 167Promoter: 3%
CpG-Island: 0%
Conserved: 31%
Enriched Motifs & Matches
Match Detail: [Jaspar]
|
| ||
|---|---|---|
| Sites: 37/100 | e-val: 0.0000039 | ||
| Factor | e-val(match) | DB |
| AP1 | 0.0000000013687 | JASPAR |
| NFE2L2 | 0.00000021408 | JASPAR |
| NFE2L1::MafG | 0.0004917 | JASPAR |
| PBX1 | 0.0064131 | JASPAR |
| PPARG | 0.062552 | JASPAR |
BED file downloads
Top 10 Example Regions
| Location | Gene Link | Dist. |
|---|---|---|
| chr1: 146764805-146764955 | RP11-337C18.4 | 29.86 |
| chr1: 146764805-146764955 | CCT8P1 | 29.86 |
| chr22: 20905820-20905970 | Y_RNA | 36.87 |
| chr22: 20905820-20905970 | XXbac-B562F10.11 | 36.87 |
| chr22: 20905820-20905970 | KLHL22 | 36.87 |
| chr22: 20905820-20905970 | AC007050.18 | 36.87 |
| chr22: 20905820-20905970 | MED15 | 36.87 |
| chr6: 3844400-3844550 | RP1-140K8.3 | 47.42 |
| chr6: 3844400-3844550 | RP11-420L9.2 | 47.42 |
| chr17: 78125260-78125410 | CARD14 | 50.29 |