Gene: CCT8P1
chr1: 146674856-146676513Expression Profile
(log scale)
Graphical Connections
Distribution of linked clusters:
You may find it interesting if many of the connected DHS sites belong to the same cluster.| Cluster Profile | Cluster ID | Number of DHS sites in this cluster |
|---|---|---|
 | 1355 | 6 |
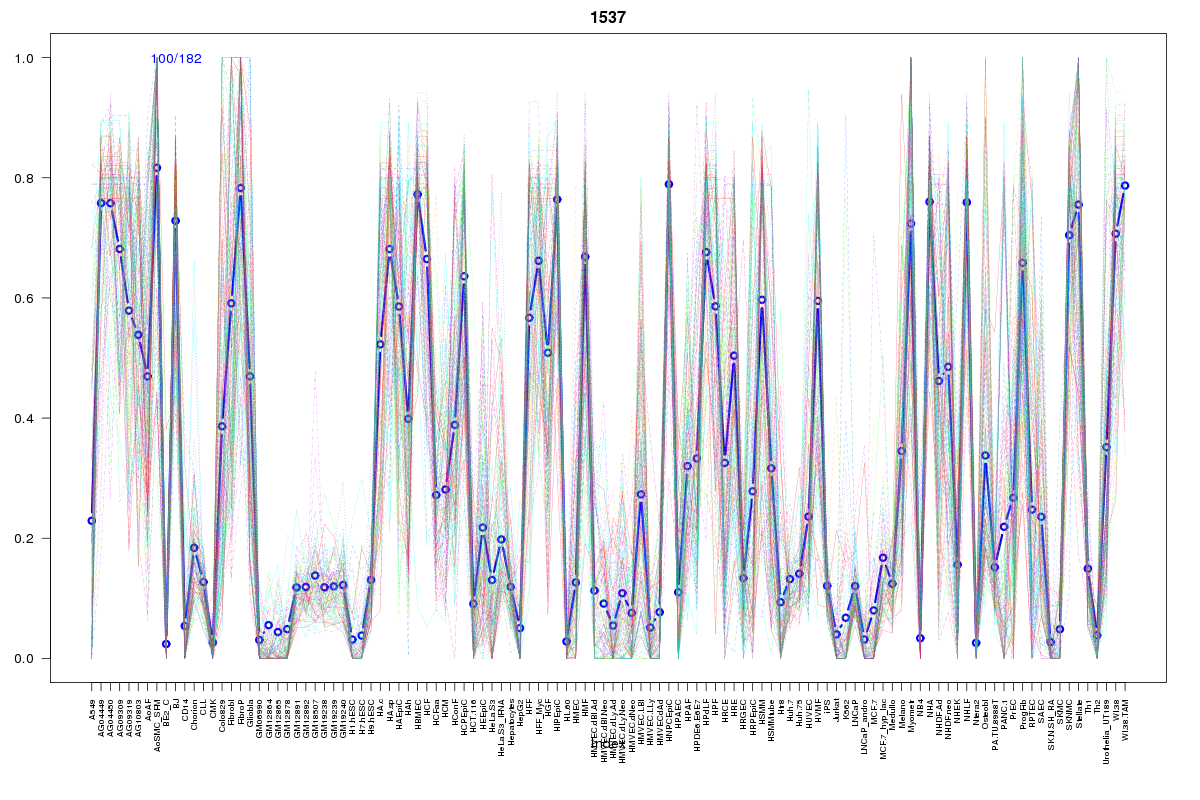 | 1537 | 3 |
 | 910 | 1 |
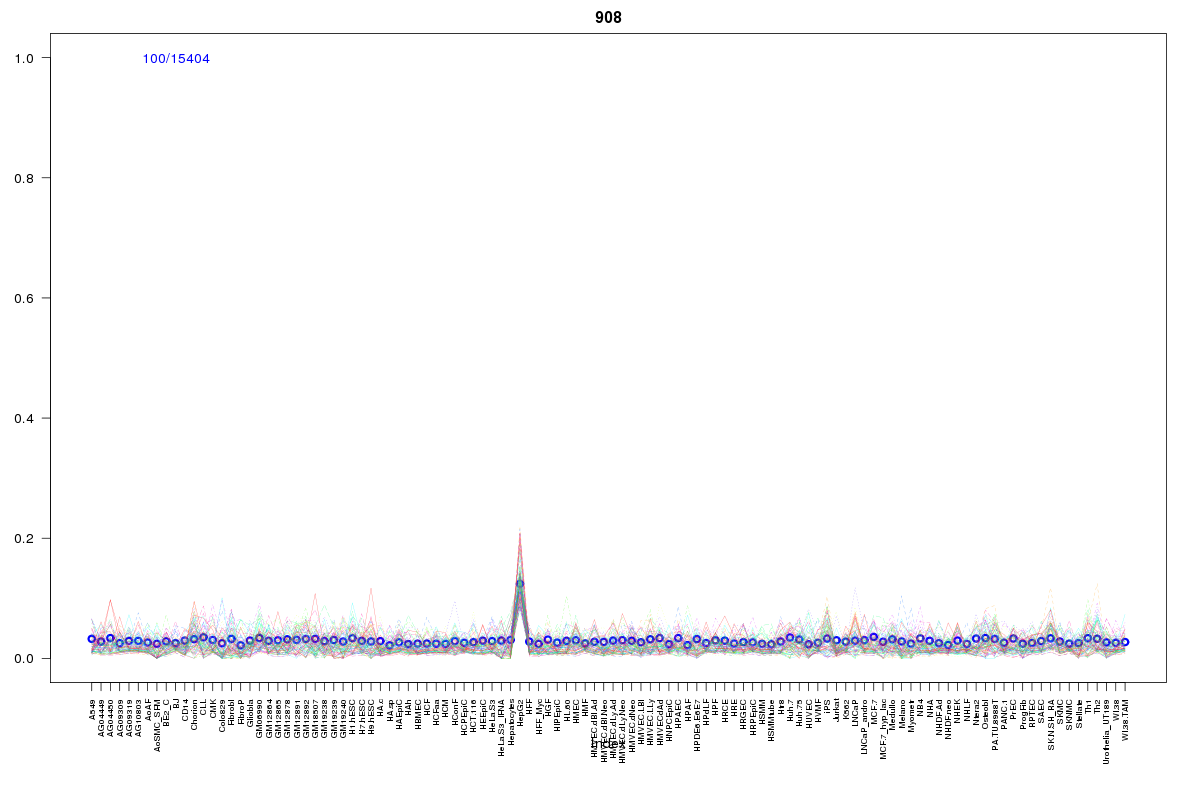 | 908 | 1 |
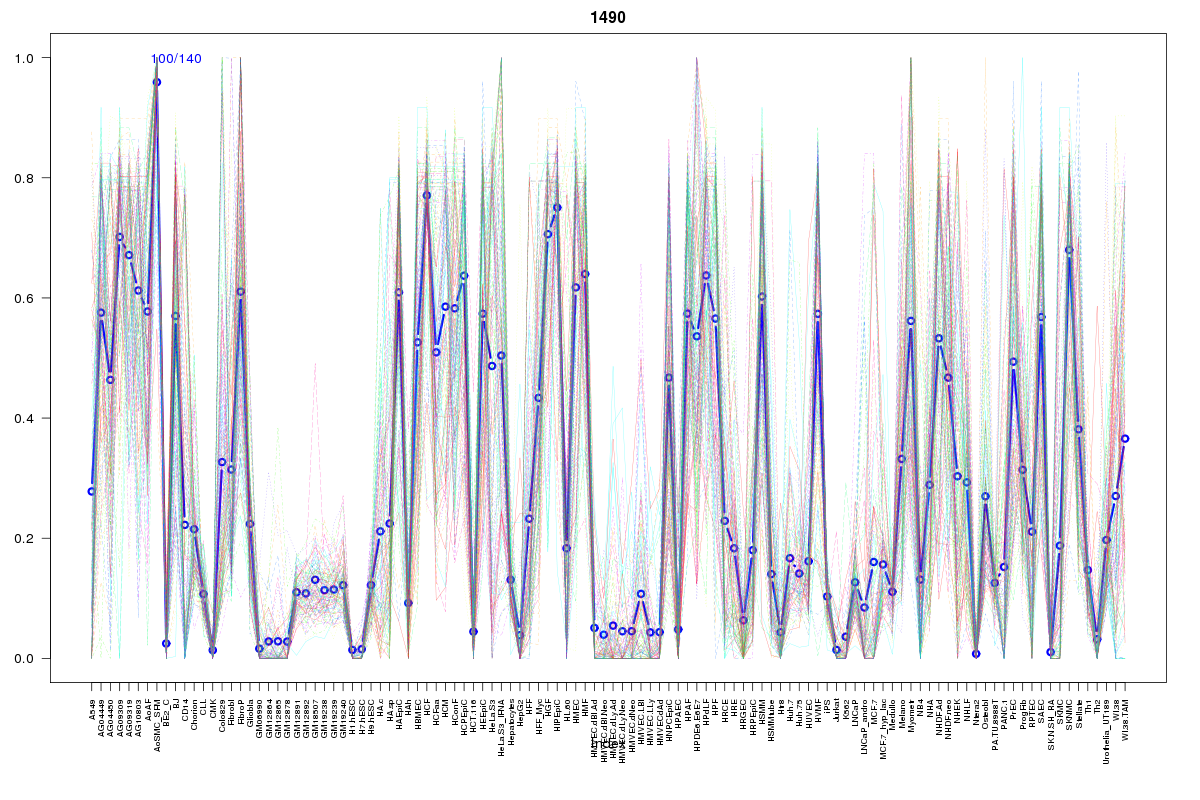 | 1490 | 1 |
 | 396 | 1 |
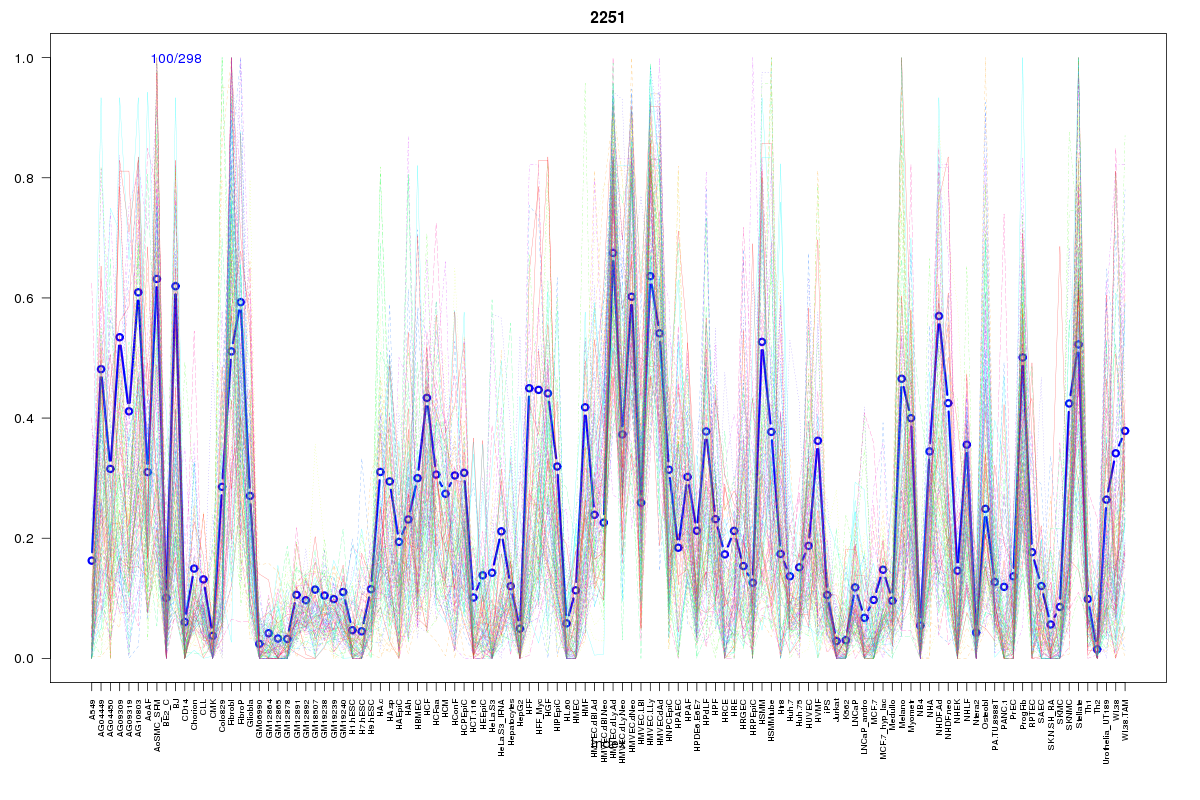 | 2251 | 1 |
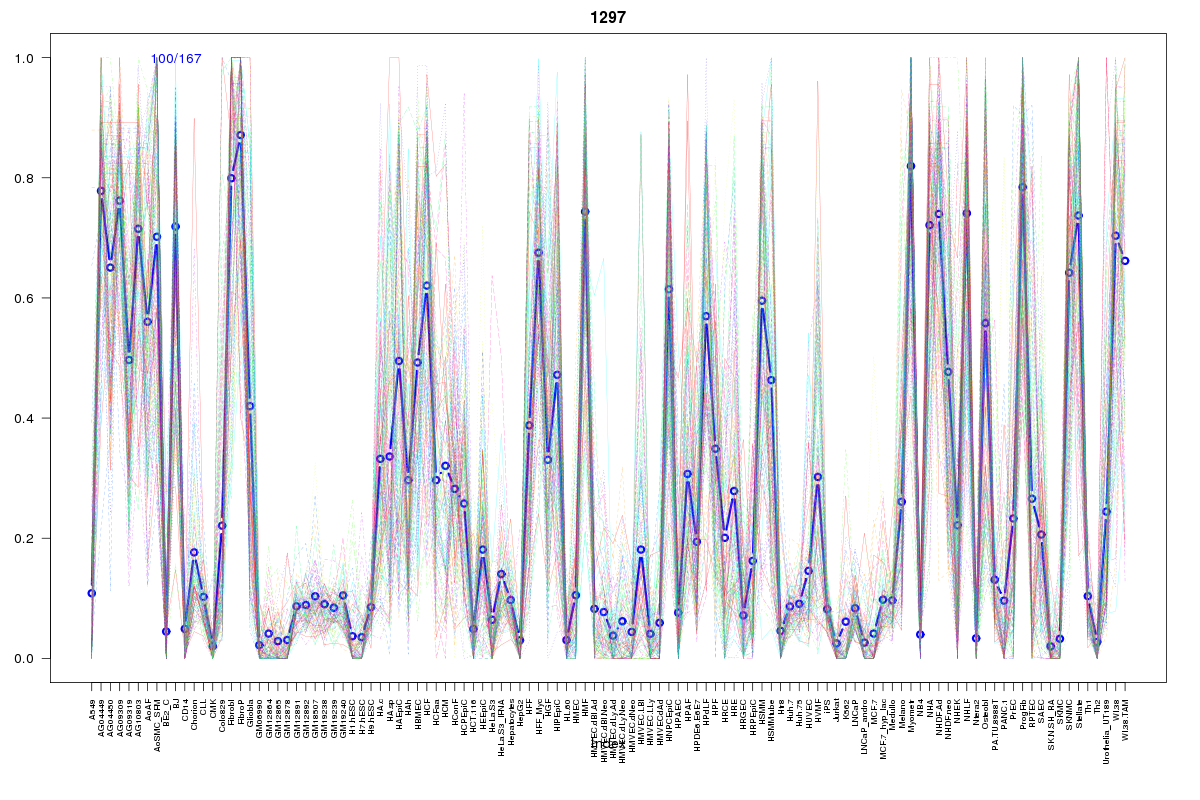 | 1297 | 1 |
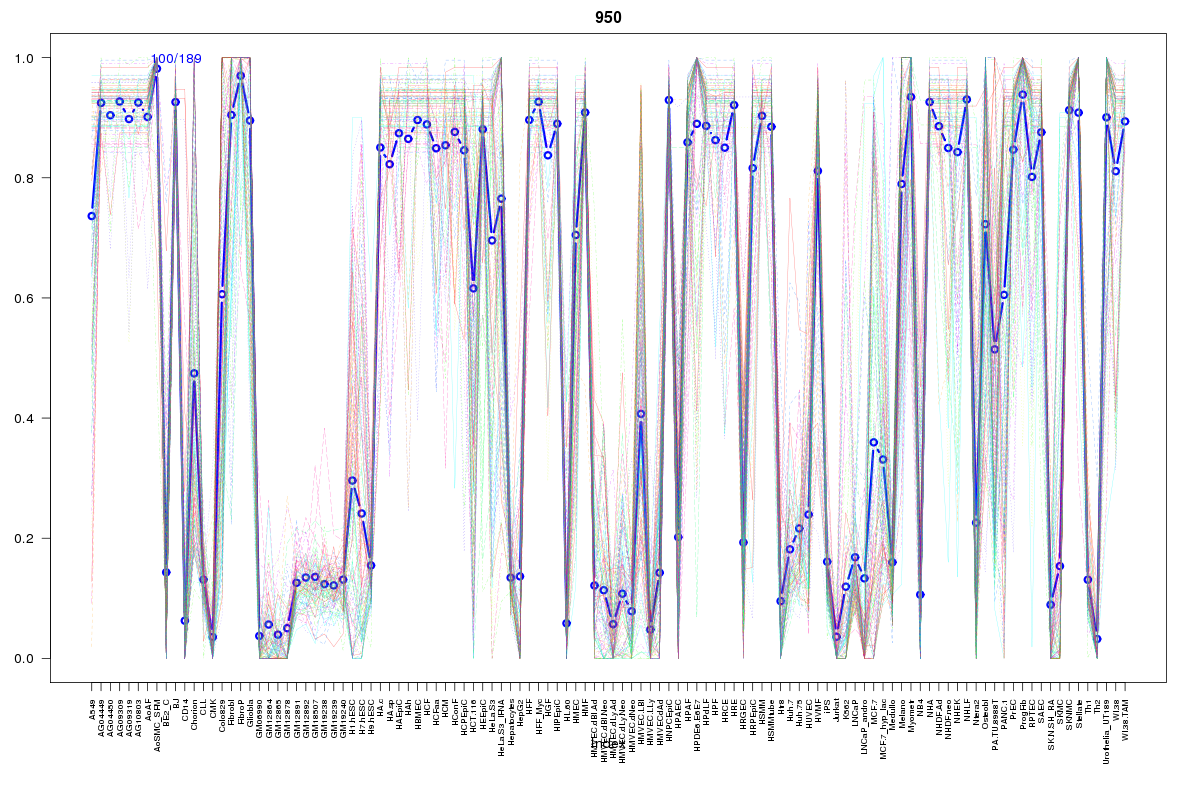 | 950 | 1 |
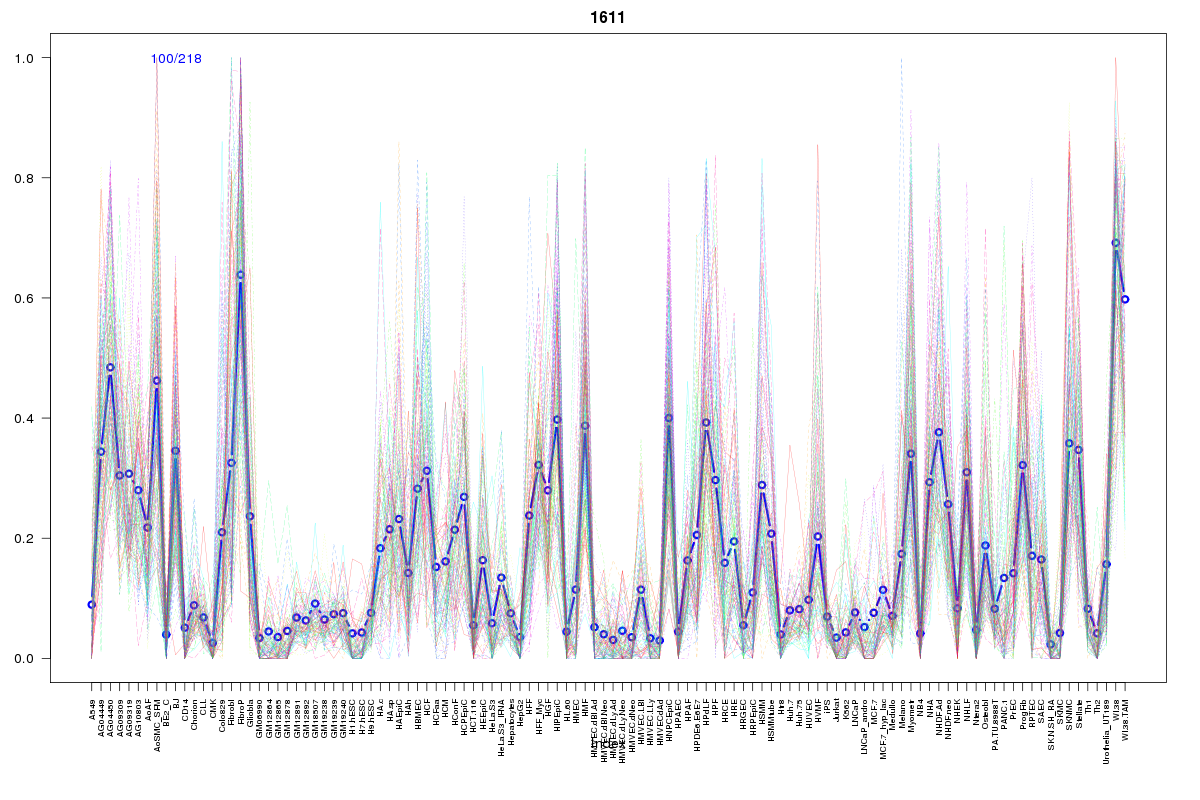 | 1611 | 1 |
Resources
BED file downloads
Connects to 17 DHS sitesTop 10 Correlated DHS Sites
p-values indiciate significant higher or lower correlation| Location | Cluster | P-value |
|---|---|---|
| chr1:146711145-146711295 | 908 | 0.001 |
| chr1:146705785-146705935 | 1355 | 0.001 |
| chr1:146710680-146710830 | 1355 | 0.002 |
| chr1:146683305-146683455 | 1355 | 0.003 |
| chr1:146710105-146710255 | 1355 | 0.004 |
| chr1:146687120-146687270 | 910 | 0.007 |
| chr1:146682645-146682795 | 1355 | 0.015 |
| chr1:146687305-146687455 | 1355 | 0.02 |
| chr1:146745480-146745630 | 396 | 0.014 |
| chr1:146649320-146649470 | 1611 | 0.014 |
| chr1:146745160-146745310 | 1490 | 0.014 |
External Databases
UCSCEnsembl (ENSG00000226015)