SOM cluster: 1378
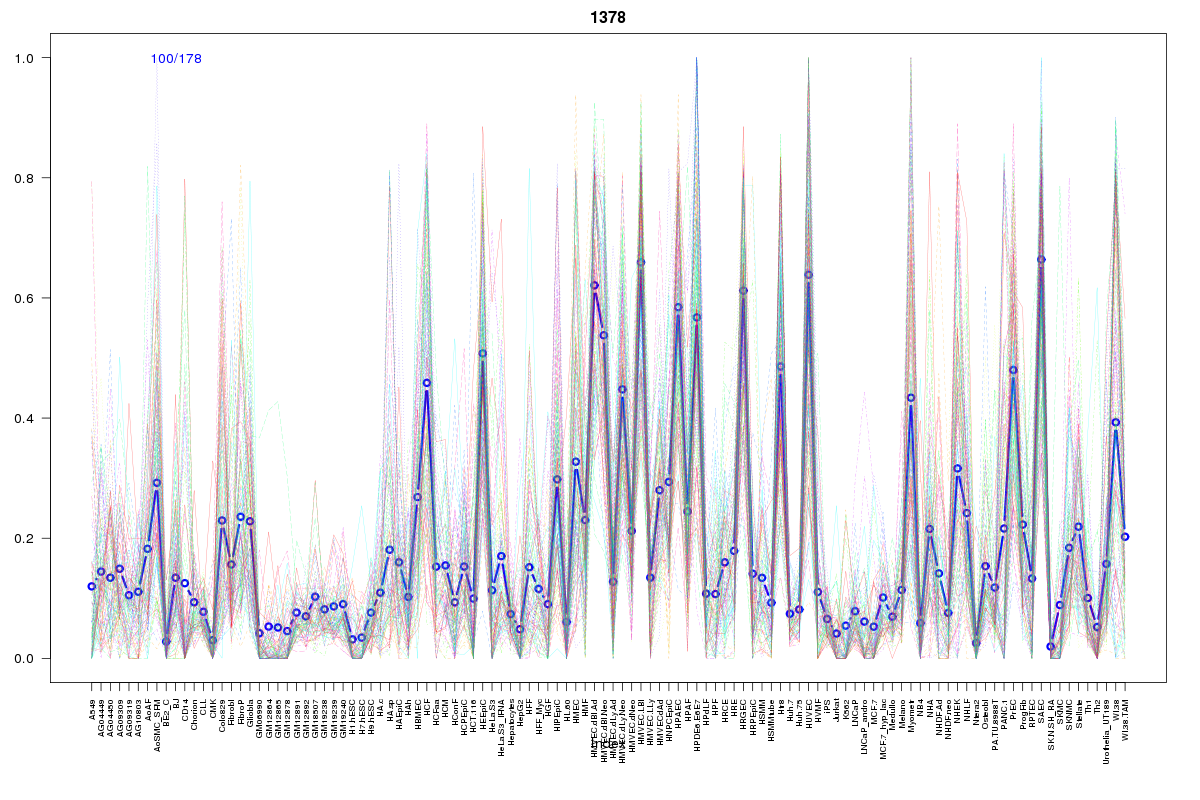
Cluster Hypersensitivity Profile

Genomic Location Trend
These plots show the distribution of the DHS sites surrounding the Transcript Start Site of the nearest gene.
Stats
Number of sites: 178Promoter: 3%
CpG-Island: 0%
Conserved: 36%
Enriched Motifs & Matches
Match Detail: [Jaspar]
|
| ||
|---|---|---|
| Sites: 49/100 | e-val: 0.0000000000032 | ||
| Factor | e-val(match) | DB |
| NFE2L2 | 0.0000000041671 | JASPAR |
| AP1 | 0.00000059878 | JASPAR |
| NFE2L1::MafG | 0.00014984 | JASPAR |
| Pdx1 | 0.0010519 | JASPAR |
| HOXA5 | 0.0032319 | JASPAR |
BED file downloads
Top 10 Example Regions
| Location | Gene Link | Dist. |
|---|---|---|
| chr3: 138610200-138610350 | ATP5G1P3 | 46.56 |
| chr3: 138610200-138610350 | RPL23AP40 | 46.56 |
| chr3: 138610200-138610350 | C3orf72 | 46.56 |
| chrX: 16607480-16607630 | RN7SL658P | 50.79 |
| chr8: 79438080-79438230 | PKIA | 57.95 |
| chr12: 76654200-76654350 | RN7SKP172 | 58.47 |
| chr12: 76654200-76654350 | RP11-54A9.1 | 58.47 |
| chr12: 76654200-76654350 | BBS10 | 58.47 |
| chr3: 27649060-27649210 | AC098614.3 | 59.16 |
| chr2: 162949360-162949510 | GCG | 61.7 |