SOM cluster: 1387
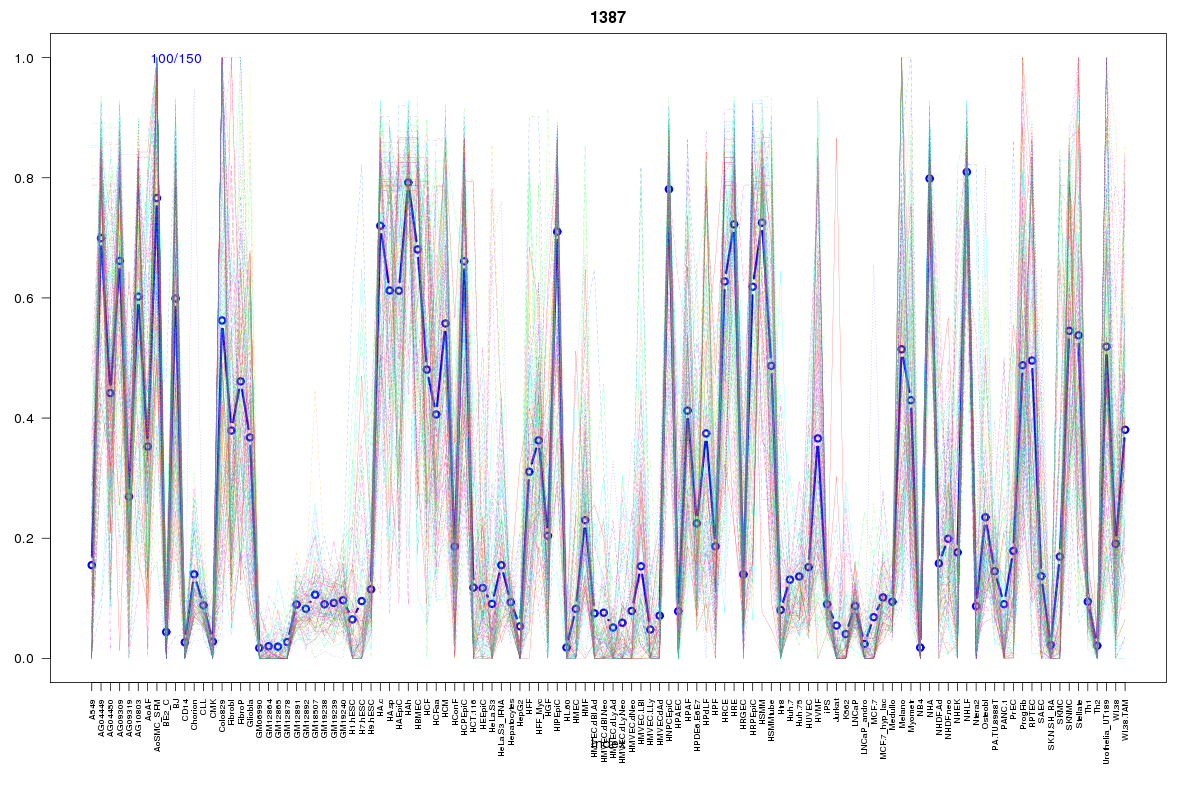
Cluster Hypersensitivity Profile

Genomic Location Trend
These plots show the distribution of the DHS sites surrounding the Transcript Start Site of the nearest gene.
Stats
Number of sites: 150Promoter: 1%
CpG-Island: 0%
Conserved: 53%
Enriched Motifs & Matches
Match Detail: [Jaspar]
|
| ||
|---|---|---|
| Sites: 51/100 | e-val: 0.0000000019 | ||
| Factor | e-val(match) | DB |
| TEAD1 | 0.00000000039326 | JASPAR |
| RELA | 0.000031777 | JASPAR |
| NF-kappaB | 0.00033908 | JASPAR |
| NFATC2 | 0.0003885 | JASPAR |
| REL | 0.0025403 | JASPAR |
|
| ||
| Sites: 33/100 | e-val: 0.0011 | ||
| Factor | e-val(match) | DB |
| RUNX1 | 0.00000008644 | JASPAR |
| ZNF354C | 0.0019994 | JASPAR |
| FOXO3 | 0.011571 | JASPAR |
| RREB1 | 0.012696 | JASPAR |
| MYC::MAX | 0.014114 | JASPAR |
|
| ||
| Sites: 19/100 | e-val: 2.5 | ||
| Factor | e-val(match) | DB |
| MEF2A | 0.0000019204 | JASPAR |
| Foxq1 | 0.0012975 | JASPAR |
| TBP | 0.0021018 | JASPAR |
| ARID3A | 0.012034 | JASPAR |
| Foxd3 | 0.014425 | JASPAR |
BED file downloads
Top 10 Example Regions
| Location | Gene Link | Dist. |
|---|---|---|
| chr7: 41919705-41919855 | GLI3 | 45.2 |
| chr12: 63086780-63086930 | MON2 | 48.2 |
| chr12: 63086780-63086930 | MIRLET7I | 48.2 |
| chr3: 156333700-156333850 | SSR3 | 50.55 |
| chr3: 156333700-156333850 | KCNAB1 | 50.55 |
| chr5: 52160340-52160490 | ITGA1 | 59.35 |
| chr1: 159399180-159399330 | RP11-550P17.5 | 60.46 |
| chr11: 36384620-36384770 | PRR5L | 63.46 |
| chr1: 103646320-103646470 | COL11A1 | 64.89 |
| chr3: 130829040-130829190 | NEK11 | 68.46 |