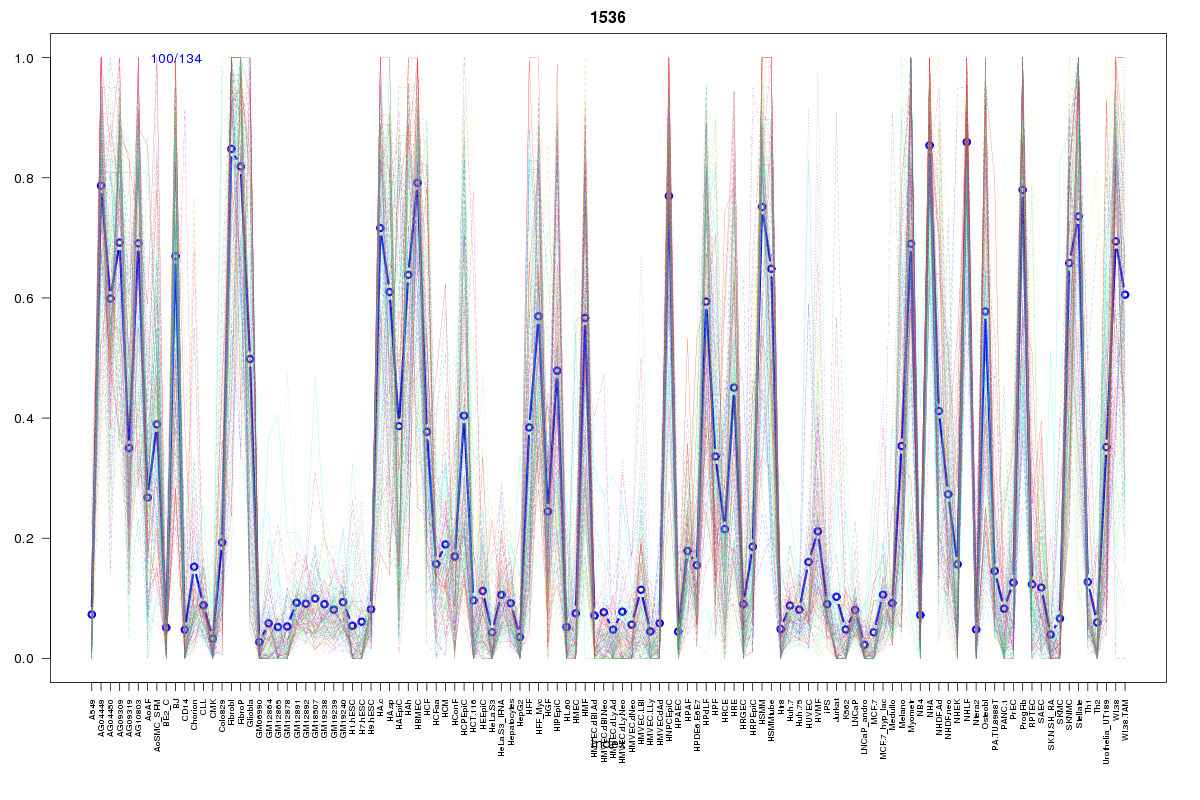
SOM cluster: 1536
Cluster Hypersensitivity Profile

Genomic Location Trend
These plots show the distribution of the DHS sites surrounding the Transcript Start Site of the nearest gene.
Stats
Number of sites: 134Promoter: 2%
CpG-Island: 0%
Conserved: 31%
Enriched Motifs & Matches
Match Detail: [Jaspar]
|
| ||
|---|---|---|
| Sites: 45/100 | e-val: 0.000000000000029 | ||
| Factor | e-val(match) | DB |
| AP1 | 0.000000000015004 | JASPAR |
| NFE2L2 | 0.0000000077679 | JASPAR |
| PPARG | 0.003657 | JASPAR |
| NFE2L1::MafG | 0.0065798 | JASPAR |
| PBX1 | 0.012991 | JASPAR |
|
| ||
| Sites: 46/100 | e-val: 0.00000000063 | ||
| Factor | e-val(match) | DB |
| RUNX1 | 0.0000035068 | JASPAR |
| MYC::MAX | 0.0014581 | JASPAR |
| MAX | 0.0039541 | JASPAR |
| ZNF354C | 0.0044092 | JASPAR |
| Klf4 | 0.024119 | JASPAR |
|
| ||
| Sites: 19/100 | e-val: 2.2 | ||
| Factor | e-val(match) | DB |
| EWSR1-FLI1 | 0.000001118 | JASPAR |
| SPIB | 0.00016327 | JASPAR |
| SP1 | 0.0010129 | JASPAR |
| Tal1::Gata1 | 0.002664 | JASPAR |
| NFATC2 | 0.003348 | JASPAR |
BED file downloads
Top 10 Example Regions
| Location | Gene Link | Dist. |
|---|---|---|
| chr9: 117179925-117180075 | ORM2 | 34.58 |
| chr1: 154597740-154597890 | TDRD10 | 40.04 |
| chr1: 154597740-154597890 | UBE2Q1 | 40.04 |
| chr11: 63889120-63889270 | STIP1 | 46.44 |
| chr11: 63889120-63889270 | FERMT3 | 46.44 |
| chr8: 23032840-23032990 | RP11-1149O23.4 | 53.83 |
| chr7: 142170220-142170370 | TRBV11-2 | 54.72 |
| chr7: 142170220-142170370 | TRBV12-1 | 54.72 |
| chr3: 8800000-8800150 | OXTR | 60.62 |
| chr3: 8800000-8800150 | CAV3 | 60.62 |