SOM cluster: 1670
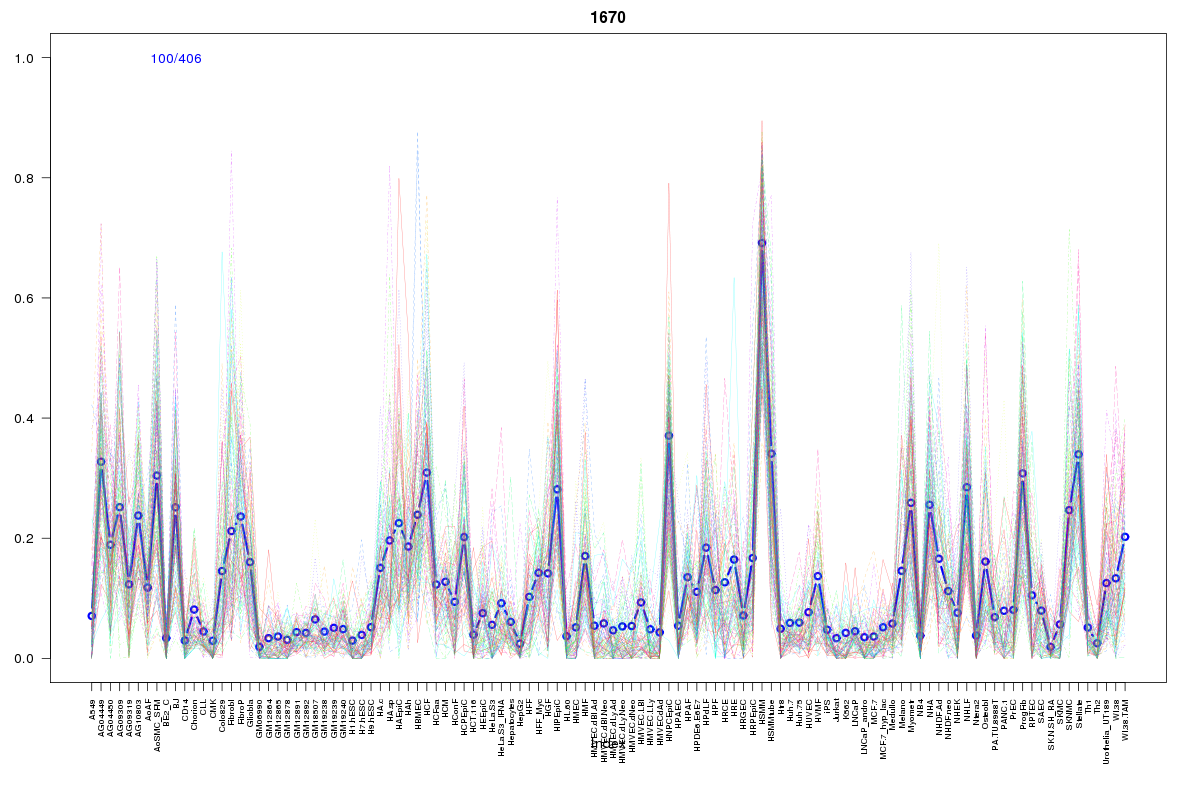
Cluster Hypersensitivity Profile

Genomic Location Trend
These plots show the distribution of the DHS sites surrounding the Transcript Start Site of the nearest gene.
Stats
Number of sites: 406Promoter: 1%
CpG-Island: 0%
Conserved: 28%
Enriched Motifs & Matches
Match Detail: [Jaspar]
|
| ||
|---|---|---|
| Sites: 25/100 | e-val: 0.0000025 | ||
| Factor | e-val(match) | DB |
| ARID3A | 0.0016105 | JASPAR |
| Prrx2 | 0.0026695 | JASPAR |
| HNF1B | 0.0047718 | JASPAR |
| Foxd3 | 0.0057527 | JASPAR |
| Lhx3 | 0.0062789 | JASPAR |
|
| ||
| Sites: 19/100 | e-val: 0.13 | ||
| Factor | e-val(match) | DB |
| MEF2A | 0.0000000029936 | JASPAR |
| HNF1A | 0.0029849 | JASPAR |
| FOXI1 | 0.0073899 | JASPAR |
| HNF1B | 0.0097056 | JASPAR |
| FOXO3 | 0.011795 | JASPAR |
BED file downloads
Top 10 Example Regions
| Location | Gene Link | Dist. |
|---|---|---|
| chr1: 41226780-41226930 | MIR30C1 | 44.75 |
| chr1: 41226780-41226930 | NFYC | 44.75 |
| chr1: 41226780-41226930 | CITED4 | 44.75 |
| chr1: 193252240-193252390 | B3GALT2 | 50.17 |
| chr1: 178027120-178027270 | RASAL2-AS1 | 53.21 |
| chr2: 136549480-136549630 | R3HDM1 | 53.53 |
| chr2: 136549480-136549630 | MCM6 | 53.53 |
| chr12: 15905860-15906010 | EPS8 | 53.6 |
| chr15: 85964480-85964630 | ADAMTS7P4 | 54.06 |
| chr4: 148897120-148897270 | ARHGAP10 | 54.62 |