SOM cluster: 1757
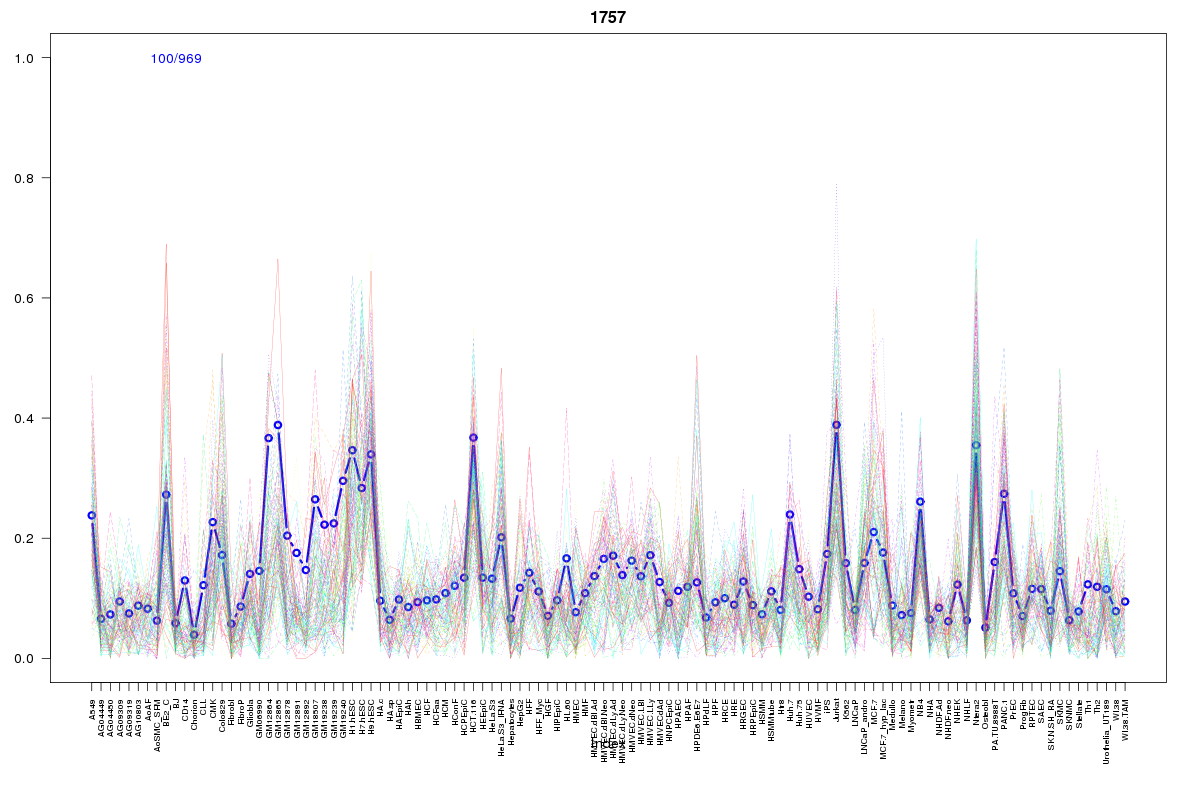
Cluster Hypersensitivity Profile

Genomic Location Trend
These plots show the distribution of the DHS sites surrounding the Transcript Start Site of the nearest gene.
Stats
Number of sites: 969Promoter: 0%
CpG-Island: 0%
Conserved: 34%
Enriched Motifs & Matches
Match Detail: [Jaspar]
|
| ||
|---|---|---|
| Sites: 35/100 | e-val: 1.2e-24 | ||
| Factor | e-val(match) | DB |
| CTCF | 0.00000000015835 | JASPAR |
| NFATC2 | 0.00036298 | JASPAR |
| MYC::MAX | 0.0008272 | JASPAR |
| INSM1 | 0.0014455 | JASPAR |
| ZEB1 | 0.01207 | JASPAR |
BED file downloads
Top 10 Example Regions
| Location | Gene Link | Dist. |
|---|---|---|
| chr3: 150784960-150785110 | MED12L | 33.29 |
| chr3: 186232200-186232350 | DNAJB11 | 37.1 |
| chr3: 186232200-186232350 | TBCCD1 | 37.1 |
| chr7: 51437585-51437735 | CICP17 | 49.72 |
| chr7: 51437585-51437735 | COBL | 49.72 |
| chr7: 128434185-128434335 | CALU | 50.55 |
| chr7: 128434185-128434335 | OPN1SW | 50.55 |
| chr7: 128434185-128434335 | FLNC | 50.55 |
| chr8: 66944700-66944850 | DNAJC5B | 51.3 |
| chr2: 77185980-77186130 | LRRTM4 | 51.56 |