Gene: TBCCD1
chr3: 186263861-186288332Expression Profile
(log scale)
Graphical Connections
Distribution of linked clusters:
You may find it interesting if many of the connected DHS sites belong to the same cluster.| Cluster Profile | Cluster ID | Number of DHS sites in this cluster |
|---|---|---|
 | 2110 | 4 |
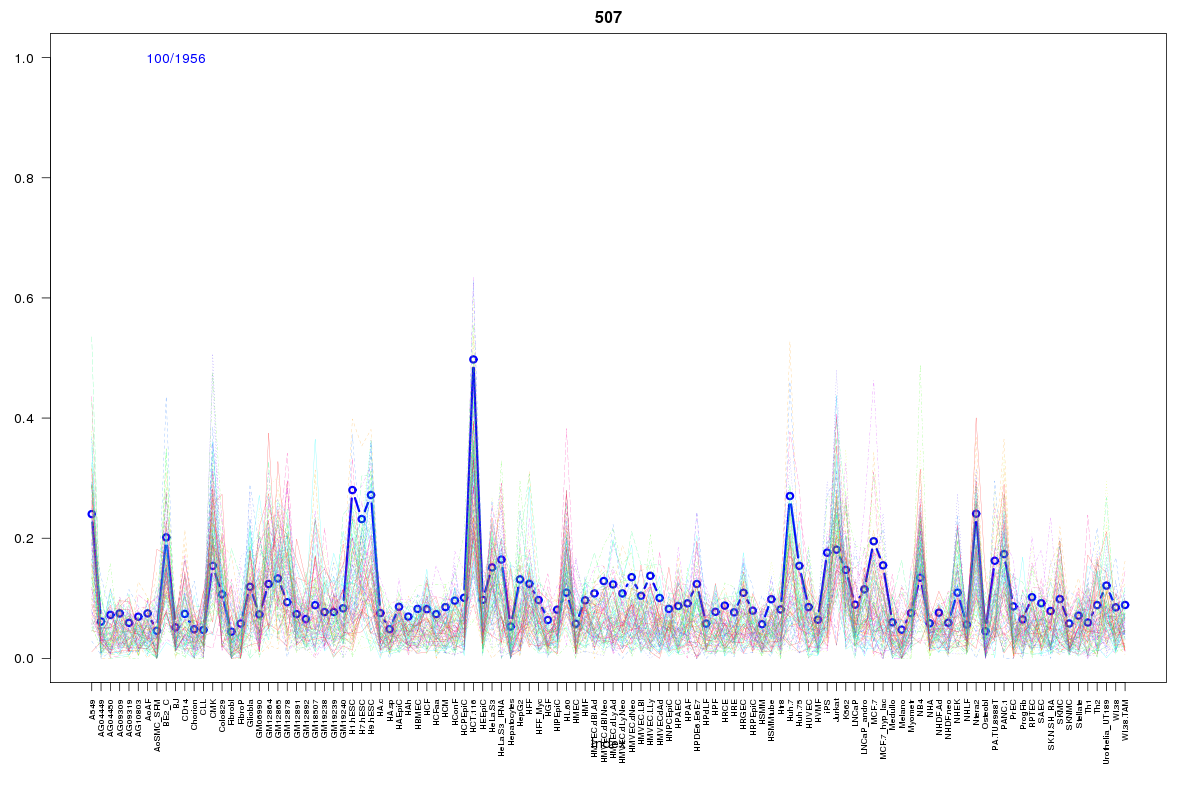 | 507 | 2 |
 | 430 | 2 |
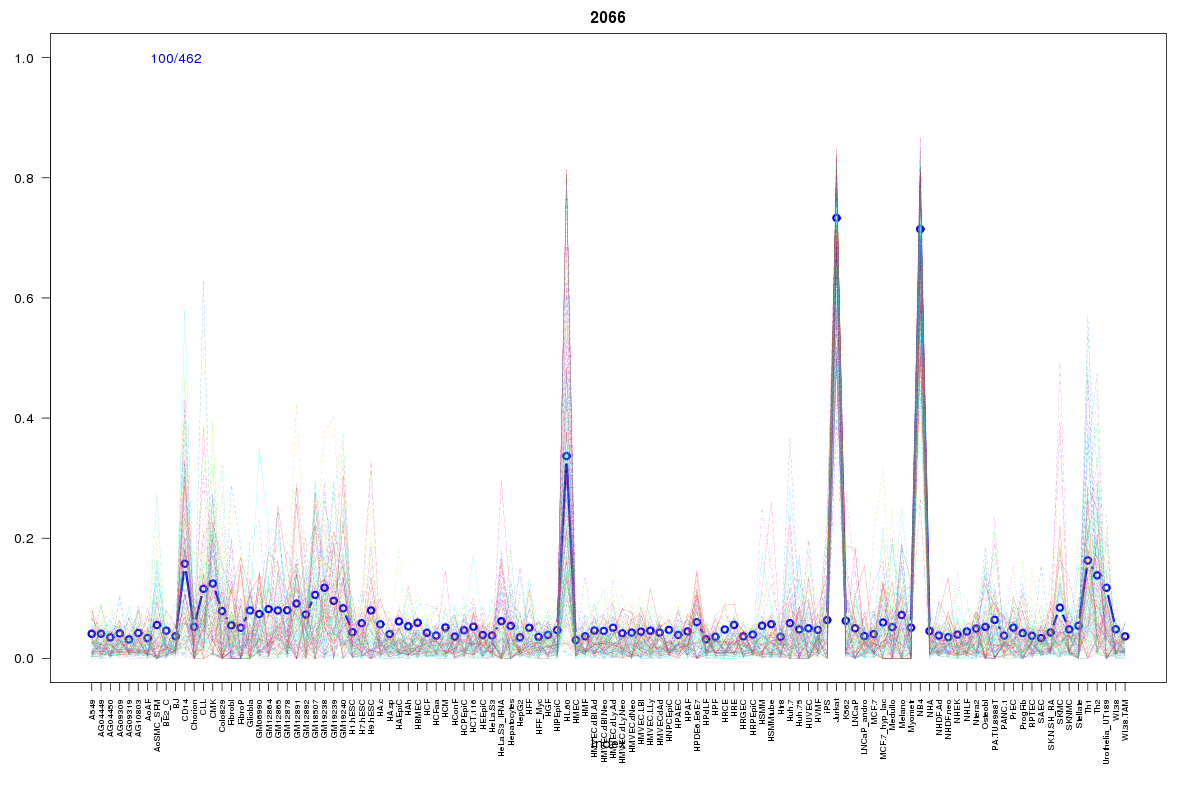 | 2066 | 2 |
 | 2211 | 2 |
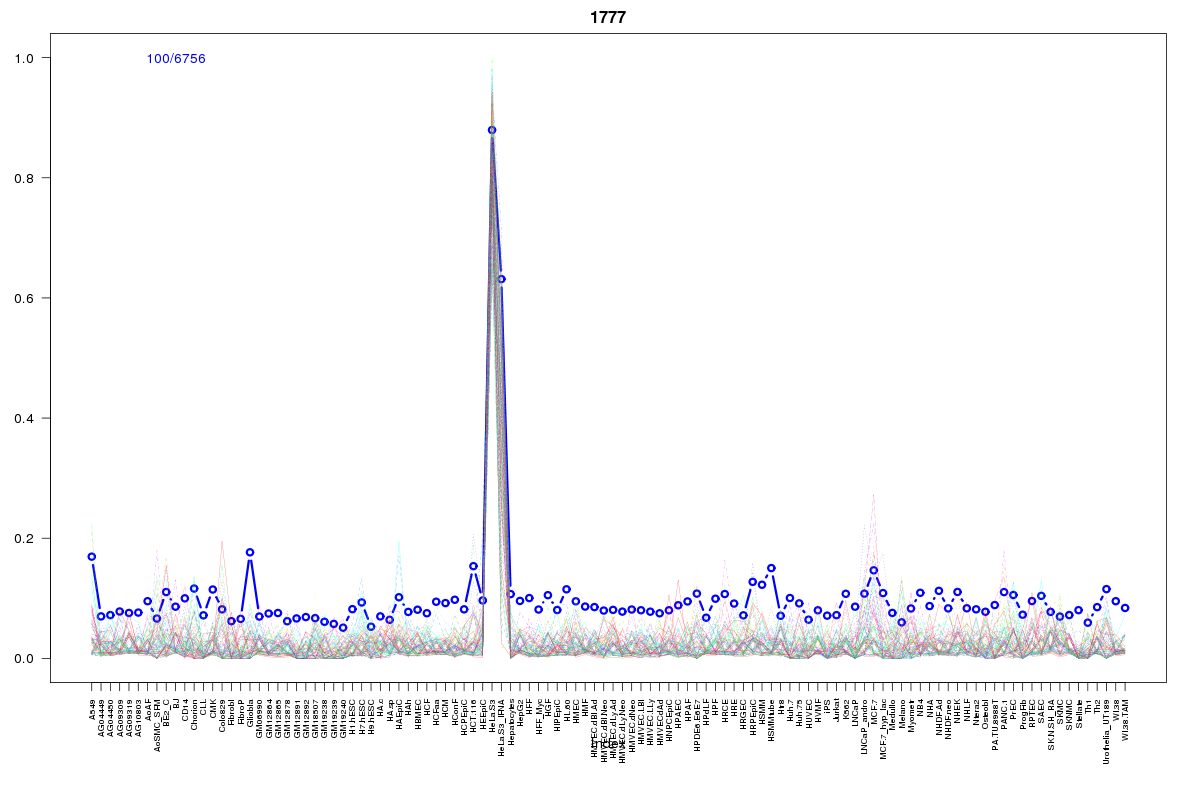 | 1777 | 1 |
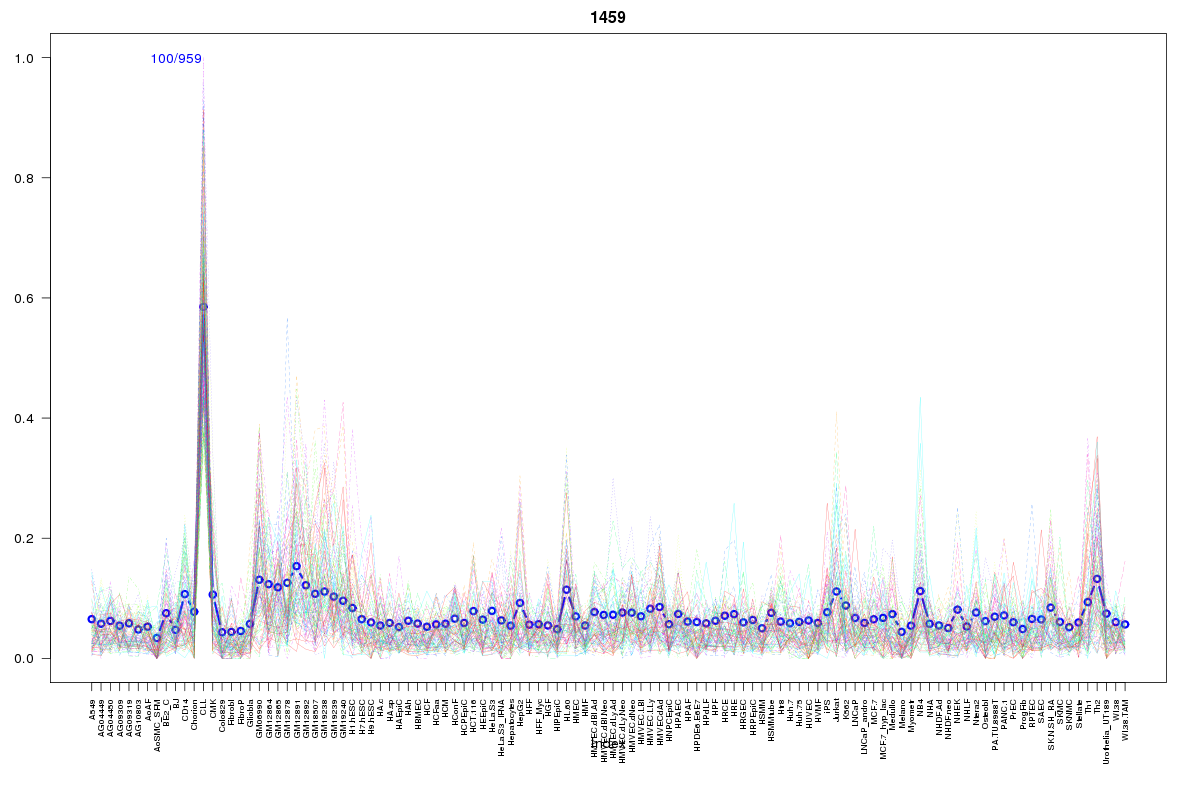 | 1459 | 1 |
 | 2017 | 1 |
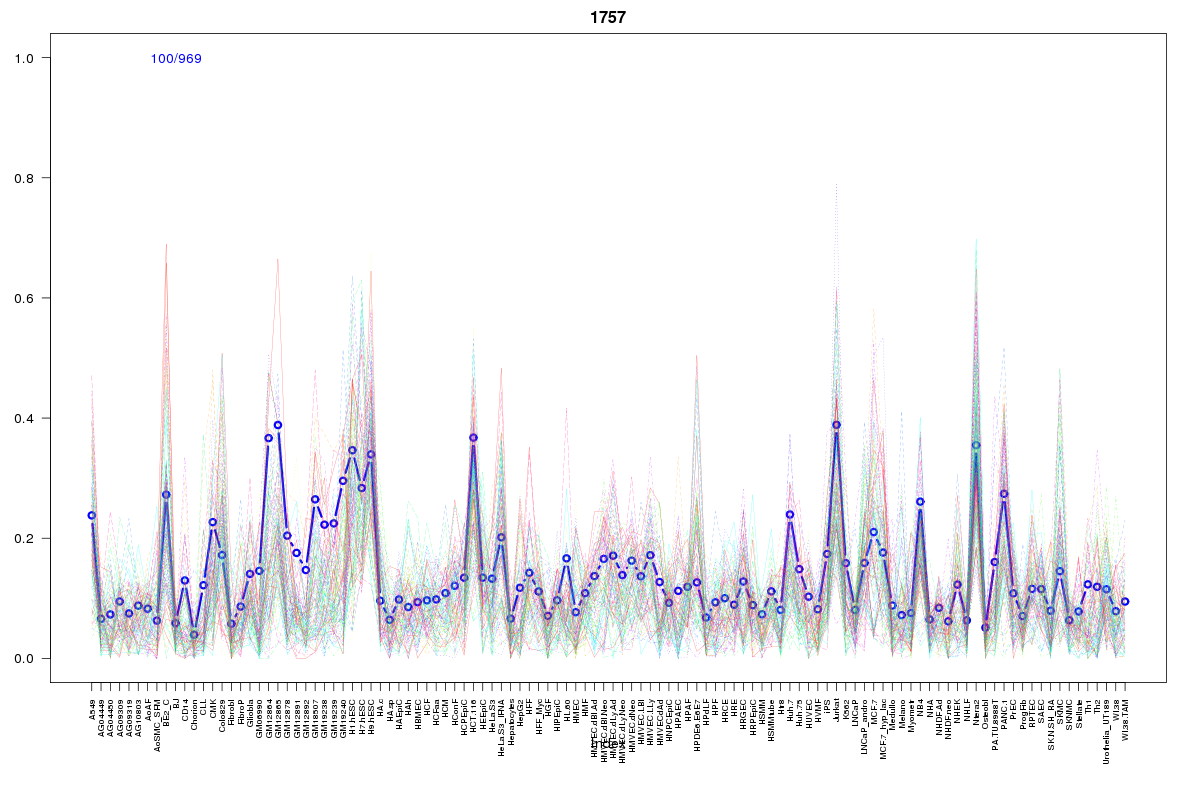 | 1757 | 1 |
 | 1401 | 1 |
 | 2072 | 1 |
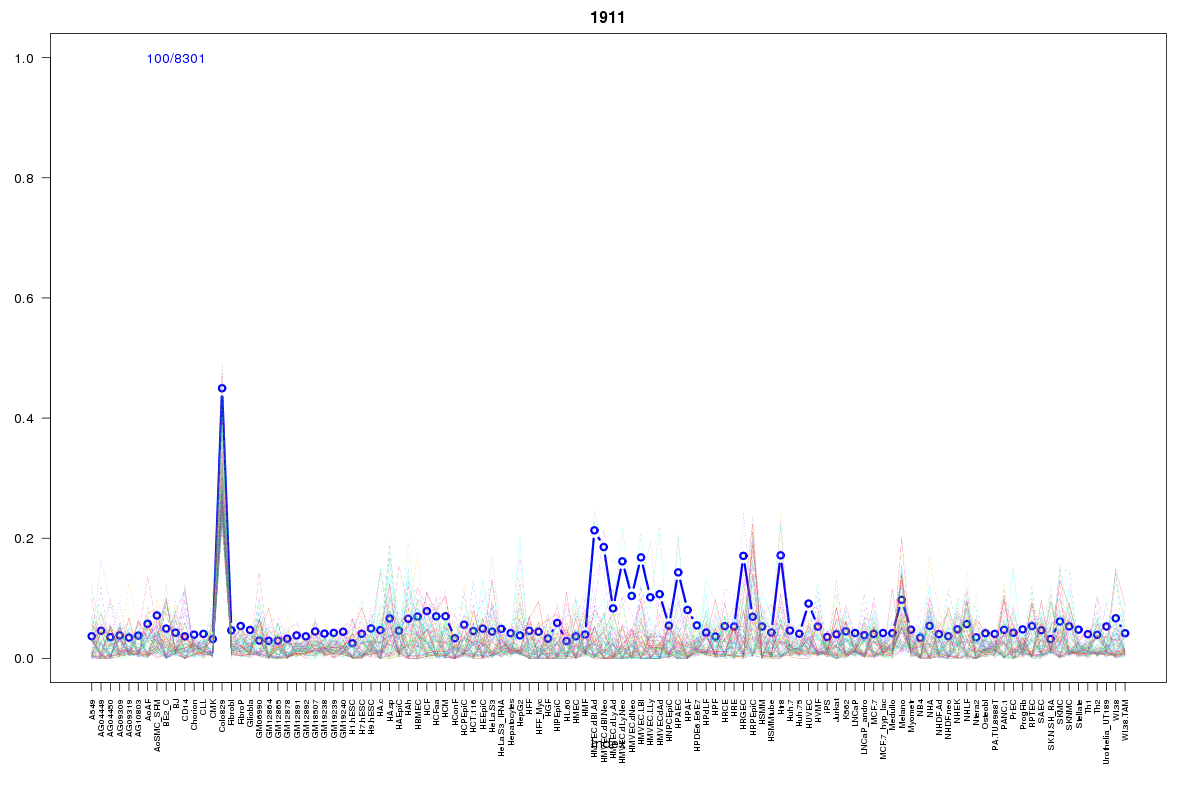 | 1911 | 1 |
 | 615 | 1 |
 | 2113 | 1 |
 | 1457 | 1 |
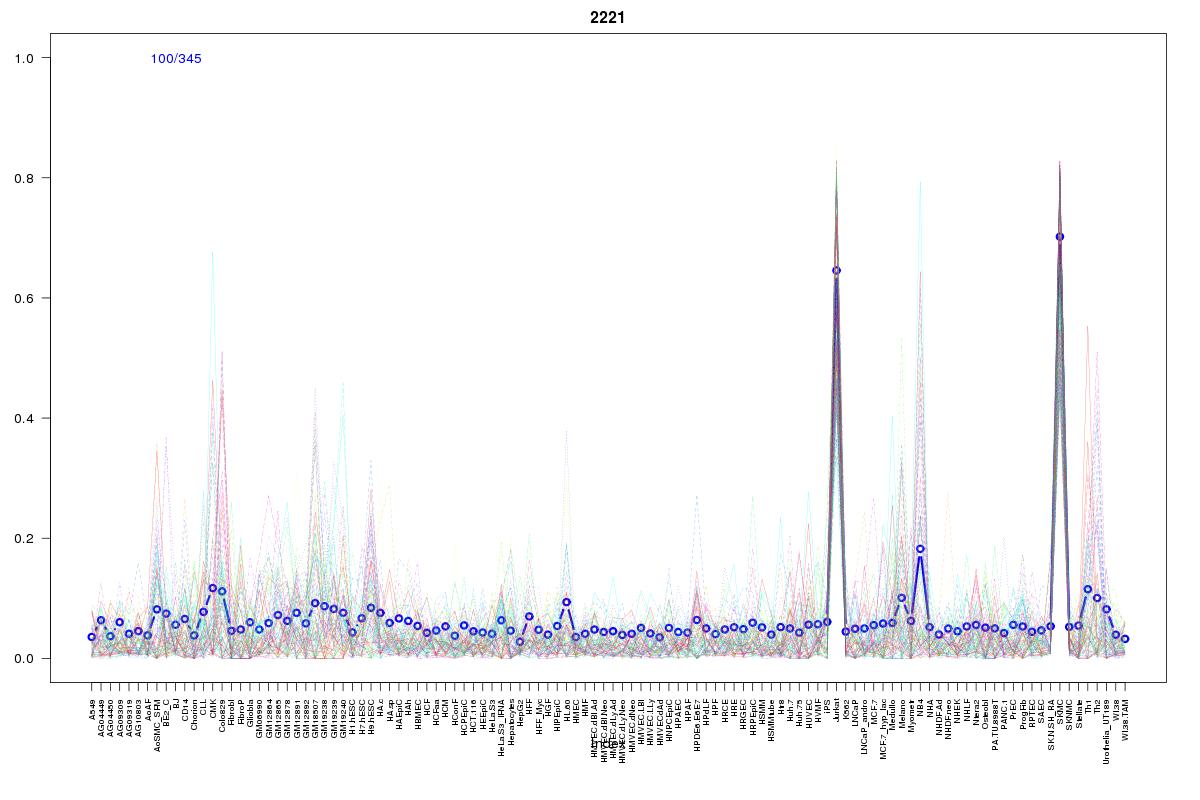 | 2221 | 1 |
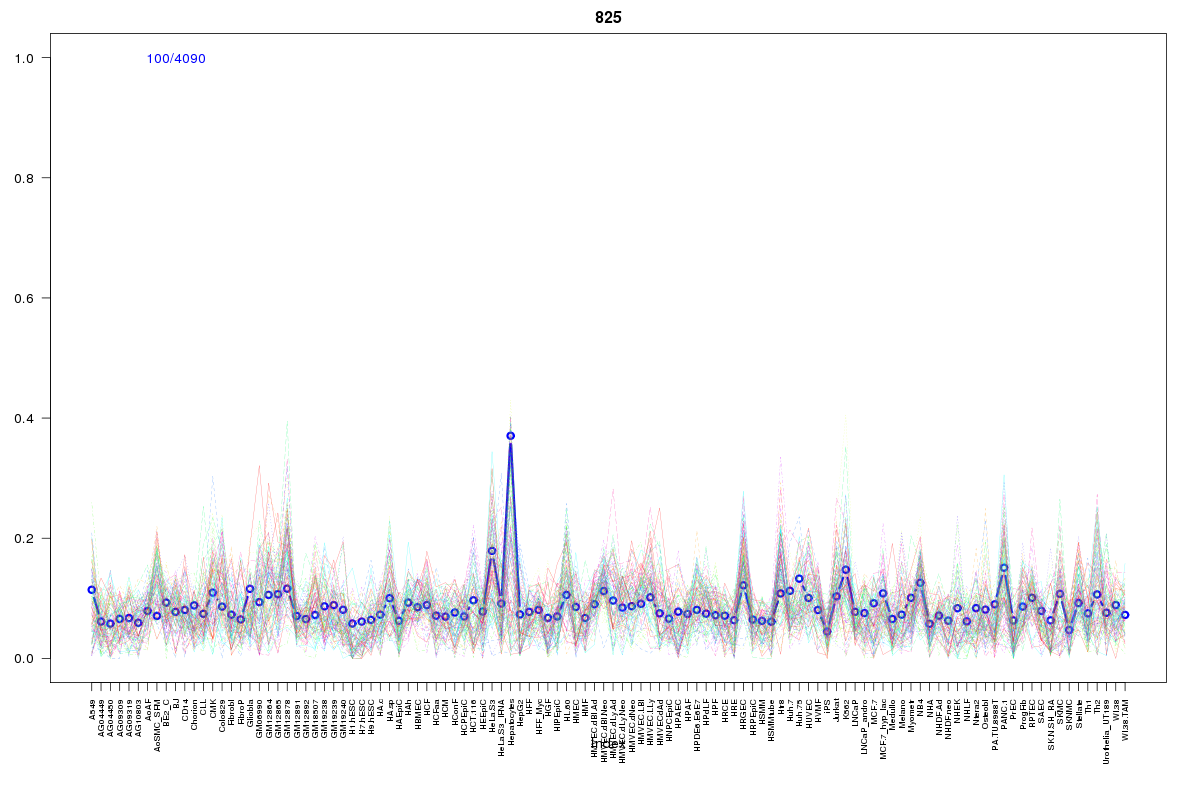 | 825 | 1 |
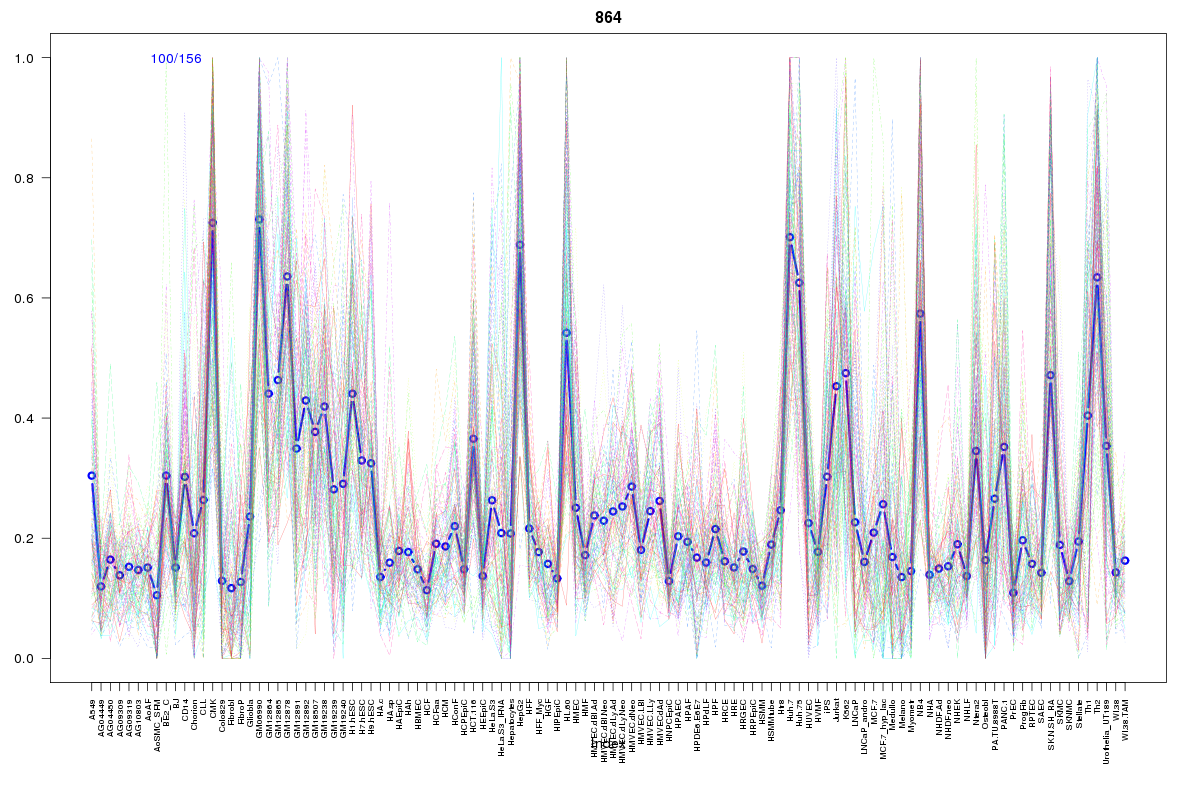 | 864 | 1 |
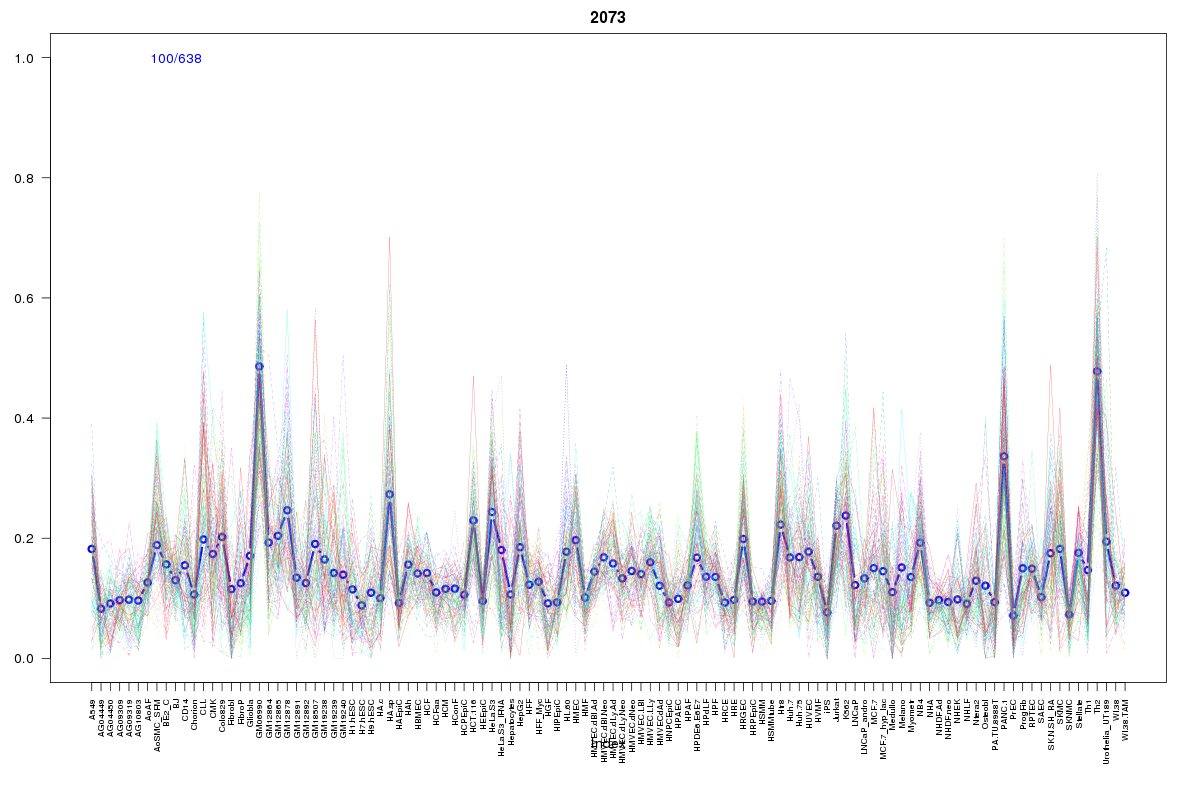 | 2073 | 1 |
 | 416 | 1 |
Resources
BED file downloads
Connects to 27 DHS sitesTop 10 Correlated DHS Sites
p-values indiciate significant higher or lower correlationExternal Databases
UCSCEnsembl (ENSG00000113838)