SOM cluster: 1794
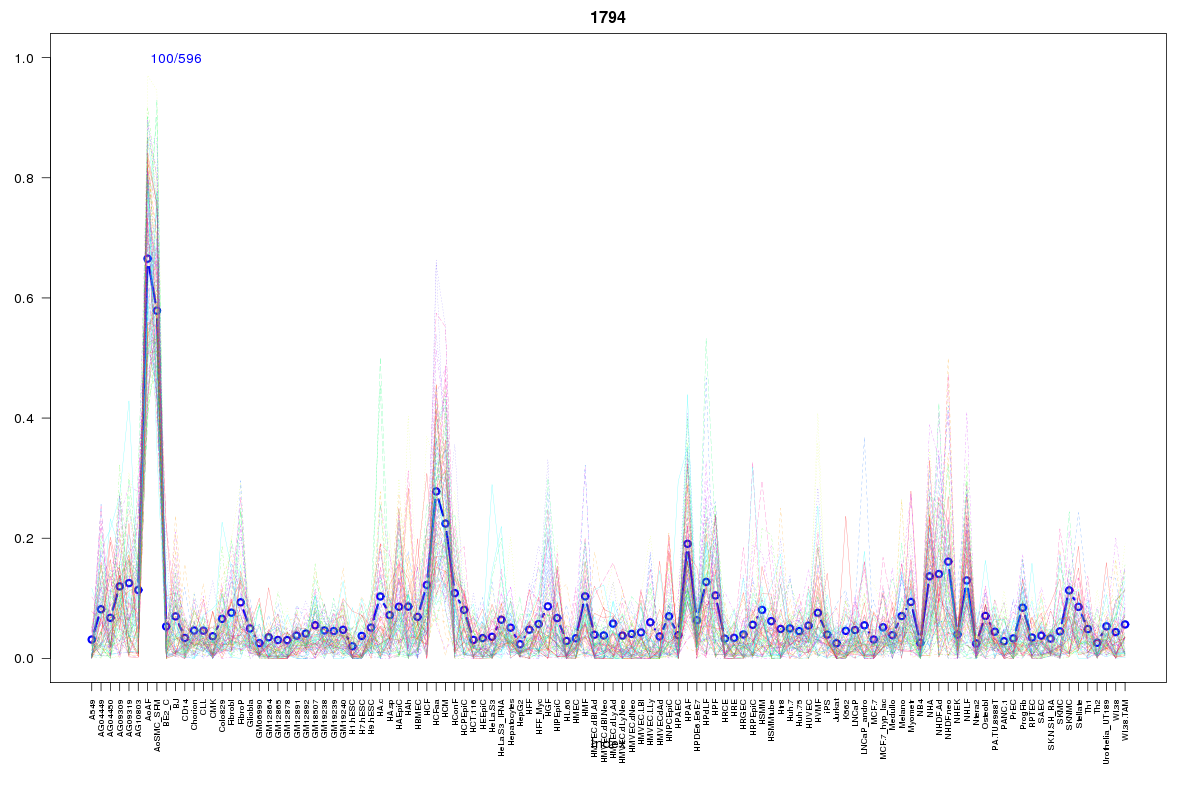
Cluster Hypersensitivity Profile

Genomic Location Trend
These plots show the distribution of the DHS sites surrounding the Transcript Start Site of the nearest gene.
Stats
Number of sites: 596Promoter: 0%
CpG-Island: 0%
Conserved: 43%
Enriched Motifs & Matches
Match Detail: [Jaspar]
|
| ||
|---|---|---|
| Sites: 21/100 | e-val: 0.0000035 | ||
| Factor | e-val(match) | DB |
| Foxd3 | 0.00048886 | JASPAR |
| Foxq1 | 0.0050278 | JASPAR |
| SRY | 0.010871 | JASPAR |
| NFATC2 | 0.011407 | JASPAR |
| Pou5f1 | 0.011564 | JASPAR |
BED file downloads
Top 10 Example Regions
| Location | Gene Link | Dist. |
|---|---|---|
| chr1: 180546620-180546770 | OVAAL | 39.74 |
| chr3: 29355620-29355770 | RPS12P5 | 40.83 |
| chr1: 26012860-26013010 | MAN1C1 | 53.01 |
| chr1: 26012860-26013010 | RP1-187B23.1 | 53.01 |
| chr9: 125189100-125189250 | PTGS1 | 60.97 |
| chrX: 65904220-65904370 | EDA2R | 67.27 |
| chr11: 125115340-125115490 | PKNOX2 | 69.87 |
| chr4: 24780620-24780770 | SOD3 | 70.46 |
| chr16: 4107640-4107790 | ADCY9 | 71.22 |
| chr6: 119491700-119491850 | MAN1A1 | 71.23 |