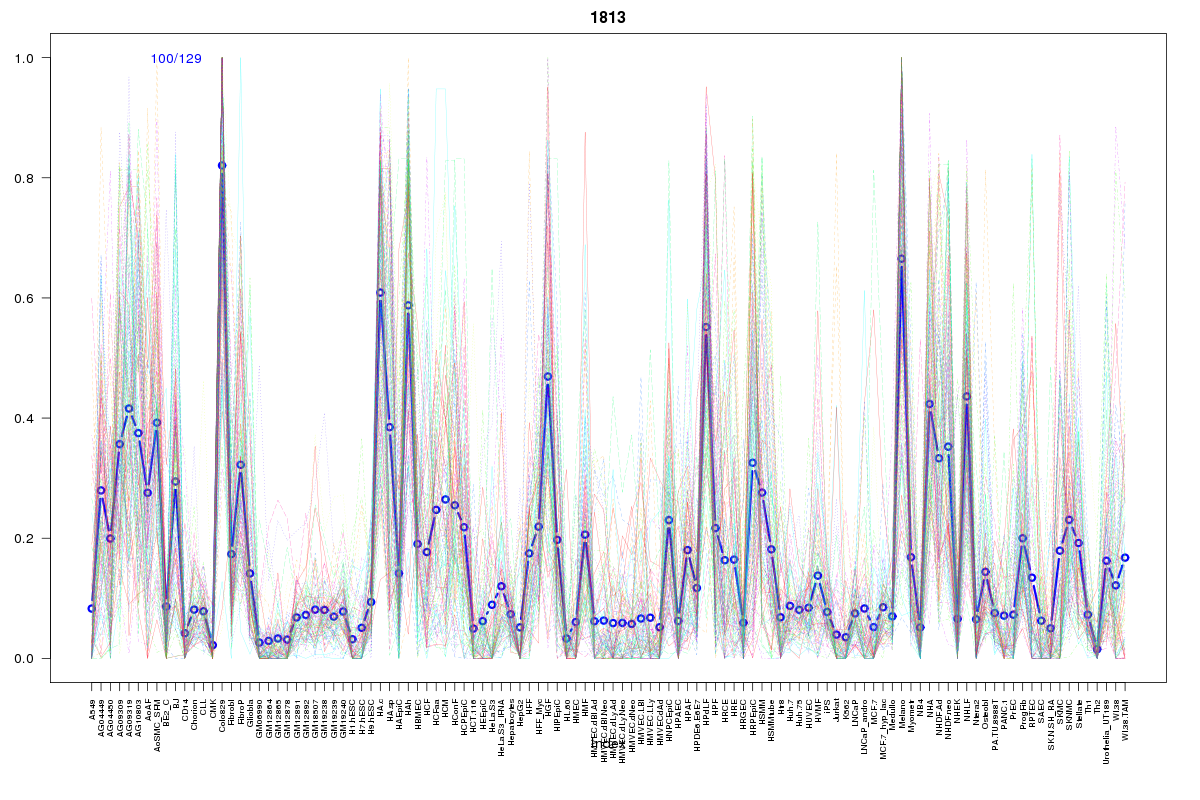
SOM cluster: 1813
Cluster Hypersensitivity Profile

Genomic Location Trend
These plots show the distribution of the DHS sites surrounding the Transcript Start Site of the nearest gene.
Stats
Number of sites: 129Promoter: 3%
CpG-Island: 1%
Conserved: 66%
Enriched Motifs & Matches
Match Detail: [Jaspar]
|
| ||
|---|---|---|
| Sites: 25/100 | e-val: 0.0000000000000091 | ||
| Factor | e-val(match) | DB |
| SOX10 | 0.0000072571 | JASPAR |
| SOX9 | 0.000054579 | JASPAR |
| MEF2A | 0.0005532 | JASPAR |
| SRY | 0.00073393 | JASPAR |
| Sox2 | 0.00092115 | JASPAR |
|
| ||
| Sites: 35/100 | e-val: 0.00012 | ||
| Factor | e-val(match) | DB |
| RREB1 | 0.000010934 | JASPAR |
| RUNX1 | 0.00003307 | JASPAR |
| Tcfcp2l1 | 0.000088551 | JASPAR |
| Pax4 | 0.0025166 | JASPAR |
| ZNF354C | 0.0044158 | JASPAR |
BED file downloads
Top 10 Example Regions
| Location | Gene Link | Dist. |
|---|---|---|
| chr8: 20060860-20061010 | LZTS1 | 53.8 |
| chr8: 20060860-20061010 | ATP6V1B2 | 53.8 |
| chr4: 174369880-174370030 | SCRG1 | 56.5 |
| chr3: 37225580-37225730 | AC097359.1 | 61.26 |
| chr3: 37225580-37225730 | UBE2FP1 | 61.26 |
| chr3: 37225580-37225730 | AC097359.2 | 61.26 |
| chr3: 37225580-37225730 | LRRFIP2 | 61.26 |
| chr4: 154088360-154088510 | TRIM2 | 66.13 |
| chr4: 129484380-129484530 | RP11-184M15.1 | 72.58 |
| chr17: 58821220-58821370 | BCAS3 | 75.69 |