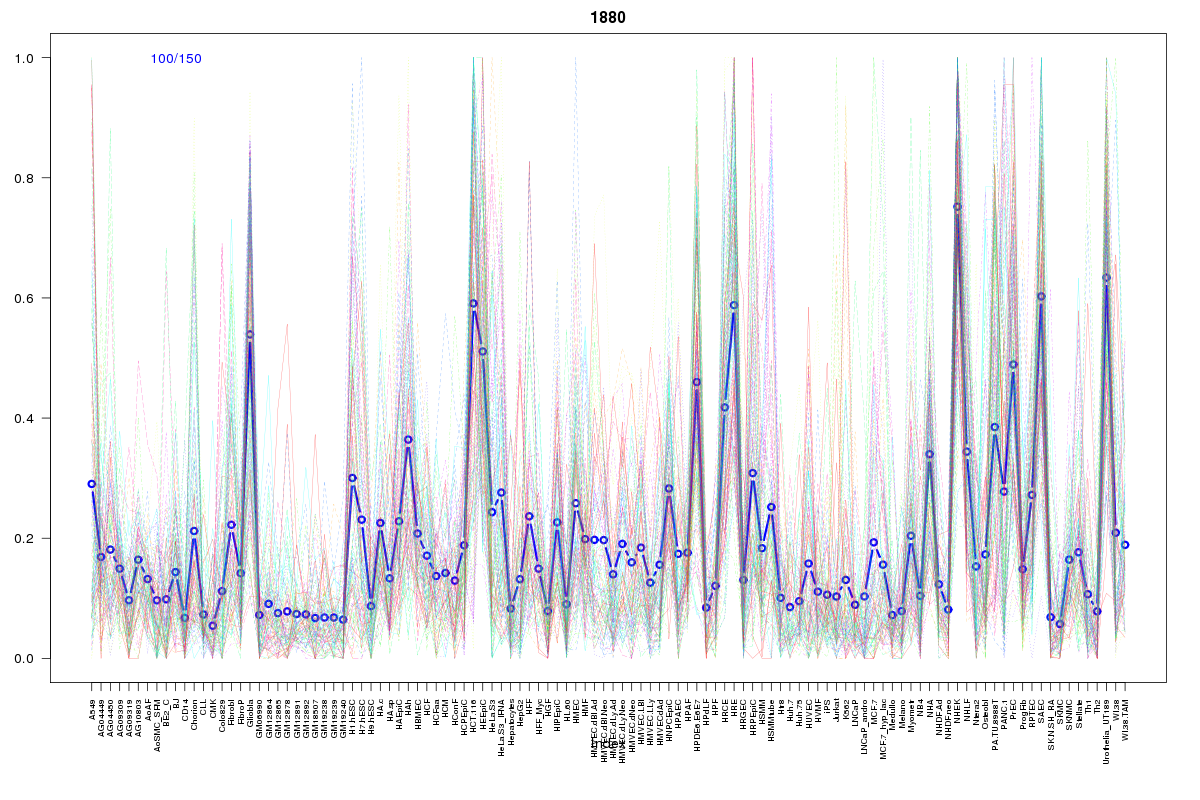
SOM cluster: 1880
Cluster Hypersensitivity Profile

Genomic Location Trend
These plots show the distribution of the DHS sites surrounding the Transcript Start Site of the nearest gene.
Stats
Number of sites: 150Promoter: 5%
CpG-Island: 2%
Conserved: 26%
Enriched Motifs & Matches
Match Detail: [Jaspar]
|
| ||
|---|---|---|
| Sites: 47/100 | e-val: 6e-23 | ||
| Factor | e-val(match) | DB |
| AP1 | 0.00000000062416 | JASPAR |
| NFE2L2 | 0.0000000009868 | JASPAR |
| PPARG | 0.00023188 | JASPAR |
| Pax2 | 0.0017654 | JASPAR |
| NFE2L1::MafG | 0.002891 | JASPAR |
BED file downloads
Top 10 Example Regions
| Location | Gene Link | Dist. |
|---|---|---|
| chr2: 119966265-119966415 | STEAP3-AS1 | 42.77 |
| chr17: 48036580-48036730 | ITGA3 | 53.02 |
| chr17: 48036580-48036730 | DLX4 | 53.02 |
| chr17: 48036580-48036730 | RP11-1094H24.4 | 53.02 |
| chr9: 99093620-99093770 | SLC35D2 | 56.68 |
| chr18: 43735800-43735950 | PSTPIP2 | 57.7 |
| chr18: 43735800-43735950 | C18orf25 | 57.7 |
| chr18: 3625300-3625450 | DLGAP1-AS1 | 58.58 |
| chr18: 3625300-3625450 | RN7SL39P | 58.58 |
| chr1: 160377720-160377870 | VANGL2 | 61.33 |