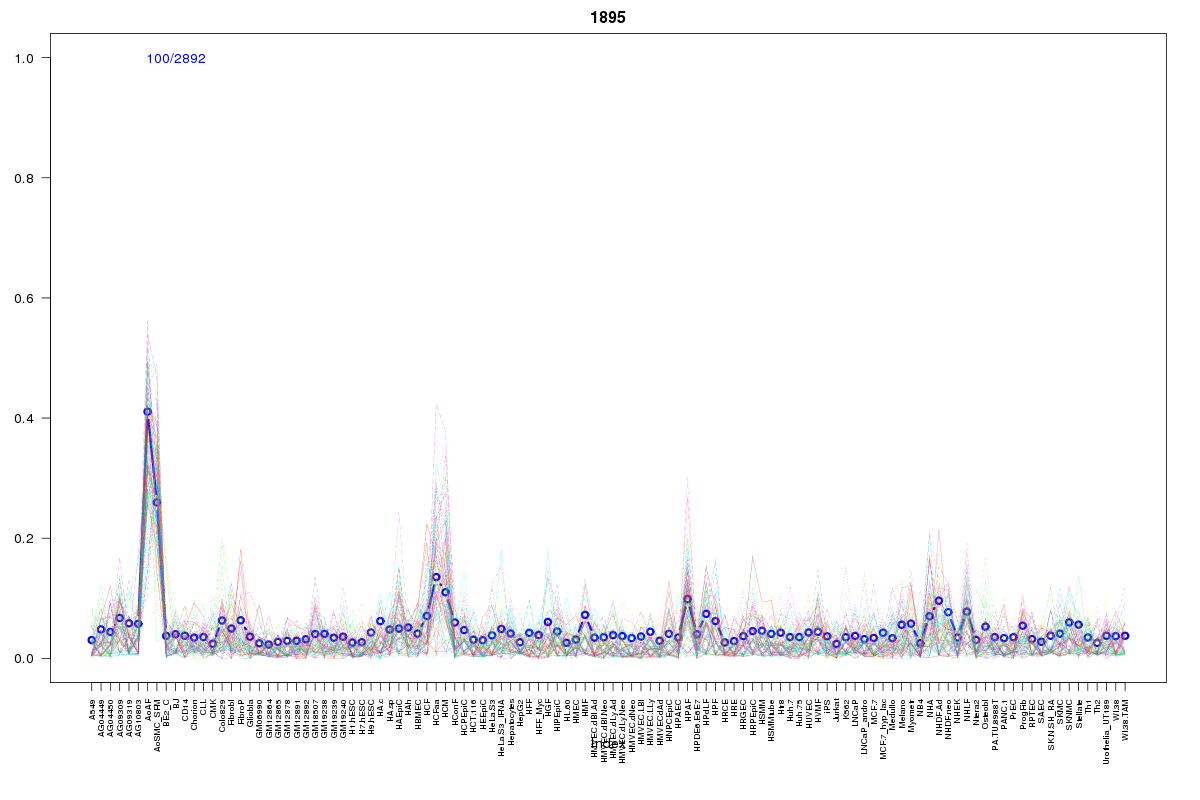
SOM cluster: 1895
Cluster Hypersensitivity Profile

Genomic Location Trend
These plots show the distribution of the DHS sites surrounding the Transcript Start Site of the nearest gene.
Stats
Number of sites: 2892Promoter: 1%
CpG-Island: 0%
Conserved: 37%
Enriched Motifs & Matches
Match Detail: [Jaspar]
|
| ||
|---|---|---|
| Sites: 38/100 | e-val: 0.000000012 | ||
| Factor | e-val(match) | DB |
| Evi1 | 0.00034271 | JASPAR |
| Lhx3 | 0.00052647 | JASPAR |
| MEF2A | 0.0022325 | JASPAR |
| Foxd3 | 0.0035189 | JASPAR |
| Foxq1 | 0.0056218 | JASPAR |
BED file downloads
Top 10 Example Regions
| Location | Gene Link | Dist. |
|---|---|---|
| chr3: 30367180-30367330 | U3 | 31.53 |
| chr9: 129714980-129715130 | RALGPS1 | 39.2 |
| chr1: 202828100-202828250 | ADIPOR1 | 41.02 |
| chr8: 124603160-124603310 | FBXO32 | 48.39 |
| chr8: 55305400-55305550 | SOX17 | 49.33 |
| chr8: 121139620-121139770 | COL14A1 | 49.37 |
| chr7: 114764740-114764890 | Y_RNA | 51.3 |
| chr1: 234639480-234639630 | RP5-855F14.1 | 52.45 |
| chr9: 118778280-118778430 | RP11-787B4.2 | 54.38 |
| chr1: 171341925-171342075 | GM2AP2 | 54.52 |