SOM cluster: 2171
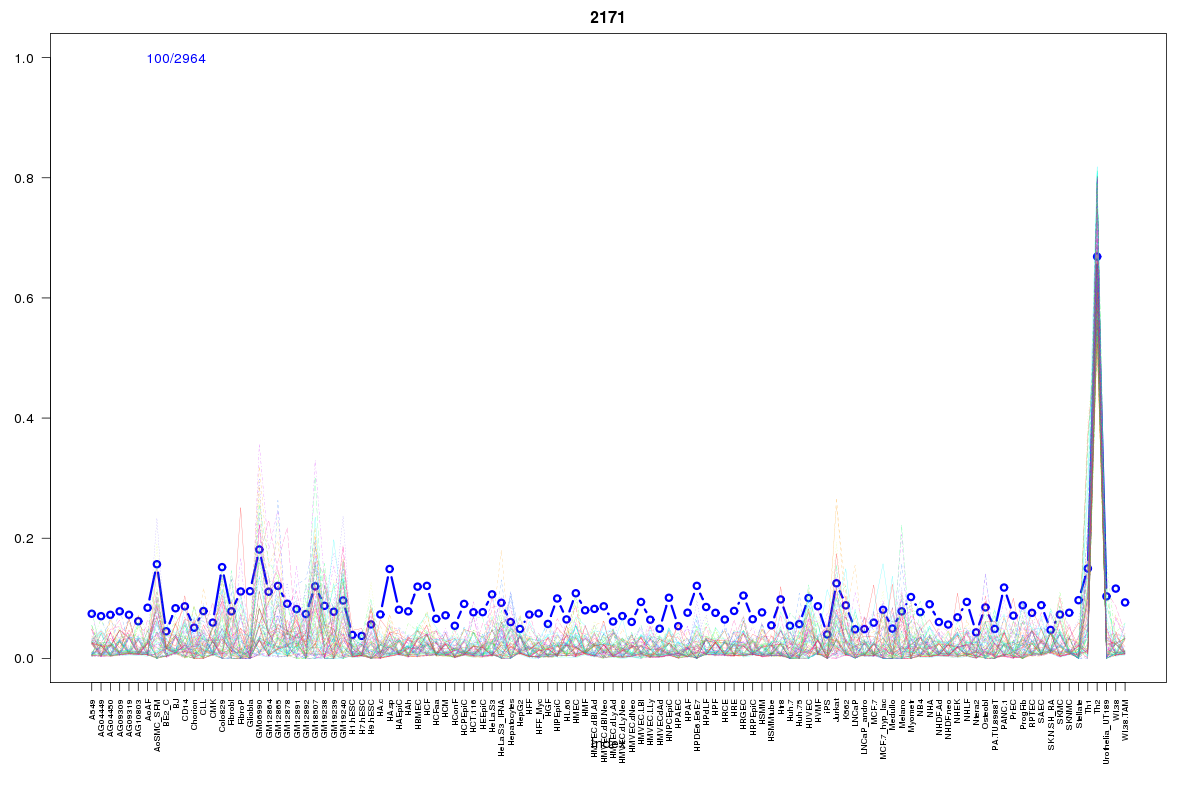
Cluster Hypersensitivity Profile

Genomic Location Trend
These plots show the distribution of the DHS sites surrounding the Transcript Start Site of the nearest gene.
Stats
Number of sites: 2964Promoter: 2%
CpG-Island: 0%
Conserved: 33%
Enriched Motifs & Matches
Match Detail: [Jaspar]
|
| ||
|---|---|---|
| Sites: 62/100 | e-val: 5.9e-36 | ||
| Factor | e-val(match) | DB |
| IRF1 | 0.0011054 | JASPAR |
| Lhx3 | 0.0033979 | JASPAR |
| NFATC2 | 0.0083651 | JASPAR |
| Foxd3 | 0.0089864 | JASPAR |
| SOX10 | 0.028944 | JASPAR |
BED file downloads
Top 10 Example Regions
| Location | Gene Link | Dist. |
|---|---|---|
| chr3: 18465420-18465570 | SATB1 | 32.72 |
| chr8: 42035465-42035615 | IKBKB | 33.61 |
| chr8: 42035465-42035615 | RP11-589C21.2 | 33.61 |
| chr5: 118669440-118669590 | TNFAIP8 | 34.66 |
| chr1: 198619160-198619310 | PTPRC | 35.92 |
| chr4: 100773440-100773590 | H2AFZ | 36.61 |
| chr4: 100773440-100773590 | DAPP1 | 36.61 |
| chr4: 100773440-100773590 | LAMTOR3 | 36.61 |
| chr10: 27010720-27010870 | RP13-16H11.7 | 41.35 |
| chr3: 121379940-121380090 | HCLS1 | 42.42 |