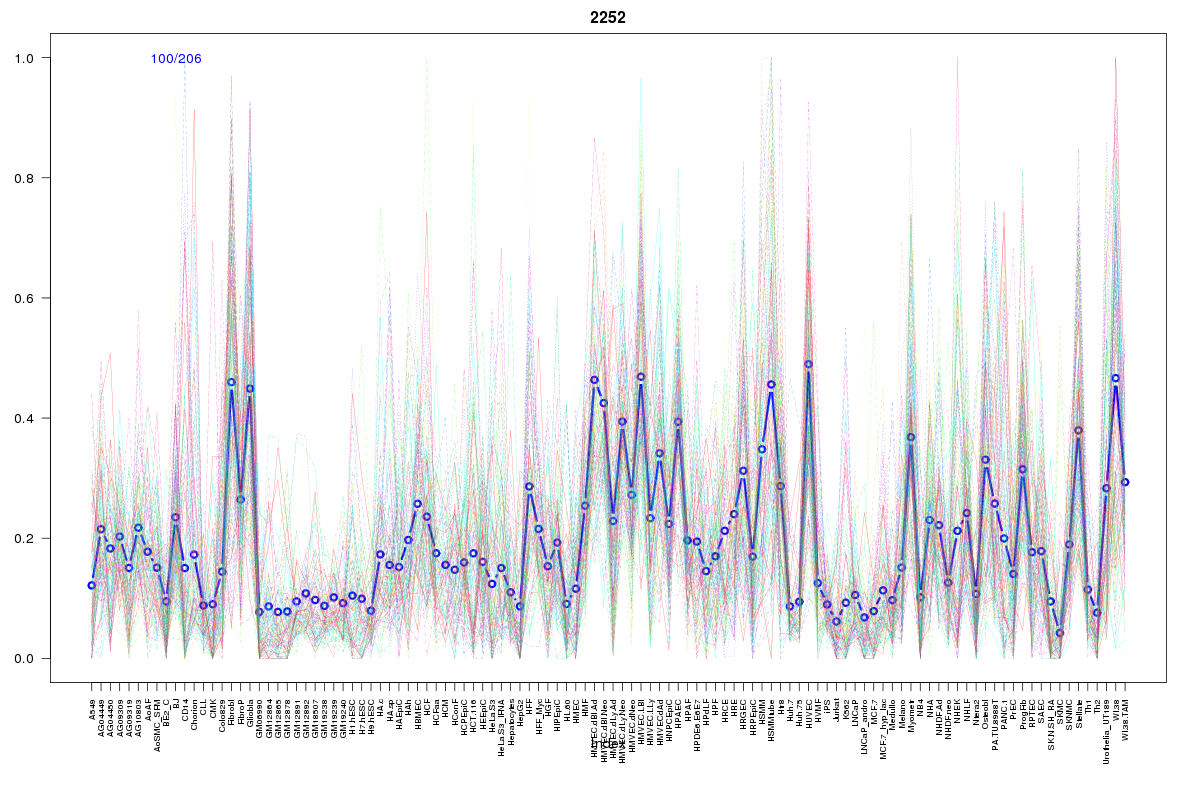
SOM cluster: 2252
Cluster Hypersensitivity Profile

Genomic Location Trend
These plots show the distribution of the DHS sites surrounding the Transcript Start Site of the nearest gene.
Stats
Number of sites: 206Promoter: 7%
CpG-Island: 0%
Conserved: 37%
Enriched Motifs & Matches
Match Detail: [Jaspar]
|
| ||
|---|---|---|
| Sites: 59/100 | e-val: 1.5e-30 | ||
| Factor | e-val(match) | DB |
| AP1 | 0.00000000046029 | JASPAR |
| NFE2L2 | 0.0000010894 | JASPAR |
| PPARG | 0.0020198 | JASPAR |
| NFE2L1::MafG | 0.016226 | JASPAR |
| RORA_2 | 0.04198 | JASPAR |
|
| ||
| Sites: 28/100 | e-val: 0.0032 | ||
| Factor | e-val(match) | DB |
| EWSR1-FLI1 | 0.000000015557 | JASPAR |
| Tal1::Gata1 | 0.00025438 | JASPAR |
| Pax4 | 0.0044901 | JASPAR |
| Ar | 0.0075691 | JASPAR |
| ZNF354C | 0.015313 | JASPAR |
|
| ||
| Sites: 19/100 | e-val: 1.1 | ||
| Factor | e-val(match) | DB |
| NFATC2 | 0.00001705 | JASPAR |
| PPARG::RXRA | 0.00049704 | JASPAR |
| FEV | 0.0017032 | JASPAR |
| SP1 | 0.0047824 | JASPAR |
| SPI1 | 0.0055105 | JASPAR |
BED file downloads
Top 10 Example Regions
| Location | Gene Link | Dist. |
|---|---|---|
| chr1: 159859585-159859735 | C1orf204 | 32.23 |
| chr1: 159859585-159859735 | CCDC19 | 32.23 |
| chr1: 159859585-159859735 | TAGLN2 | 32.23 |
| chr3: 133727385-133727535 | SLCO2A1 | 52.54 |
| chr9: 116987920-116988070 | ORM1 | 53.86 |
| chr9: 116987920-116988070 | COL27A1 | 53.86 |
| chr1: 26130845-26130995 | RP1-317E23.6 | 56.01 |
| chr1: 26130845-26130995 | SEPN1 | 56.01 |
| chr1: 26130845-26130995 | RP1-125I3.2 | 56.01 |
| chr9: 138900240-138900390 | NACC2 | 56.3 |