SOM cluster: 2448
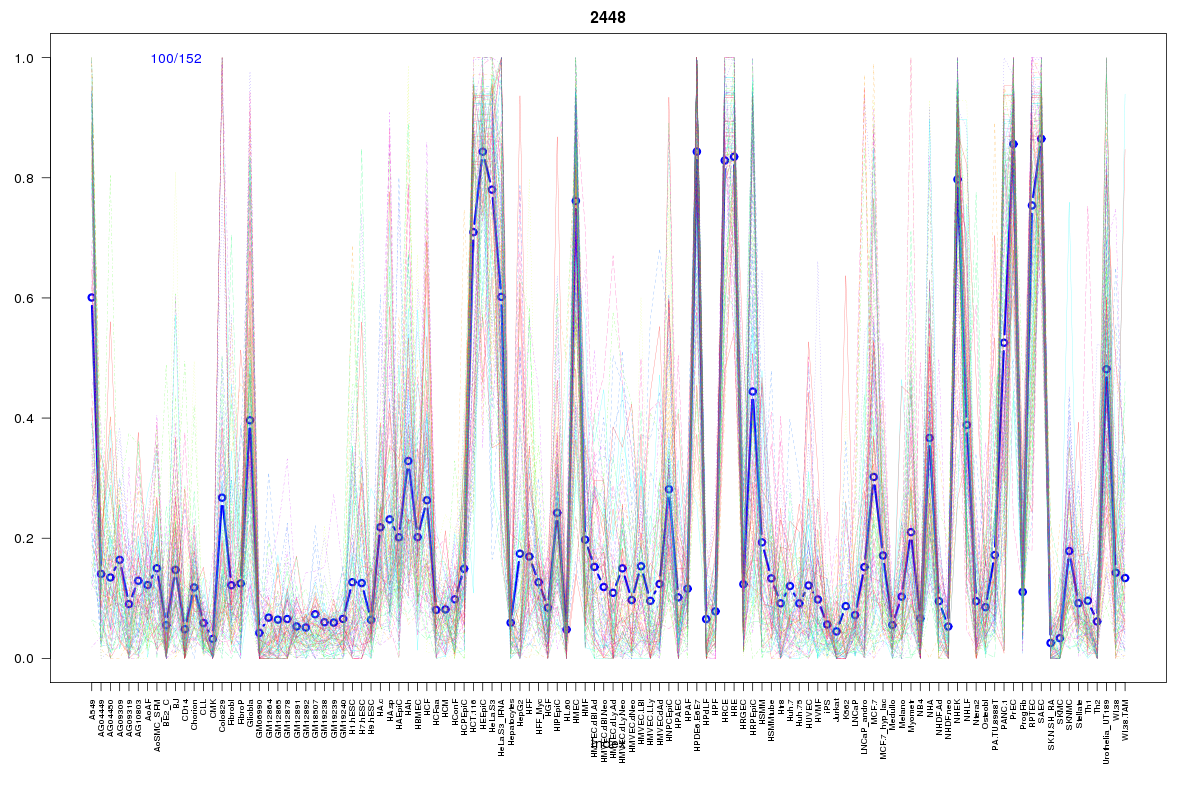
Cluster Hypersensitivity Profile

Genomic Location Trend
These plots show the distribution of the DHS sites surrounding the Transcript Start Site of the nearest gene.
Stats
Number of sites: 152Promoter: 1%
CpG-Island: 0%
Conserved: 38%
Enriched Motifs & Matches
Match Detail: [Jaspar]
|
| ||
|---|---|---|
| Sites: 56/100 | e-val: 1.5e-38 | ||
| Factor | e-val(match) | DB |
| NFE2L2 | 0.00000000075896 | JASPAR |
| AP1 | 0.0000000009609 | JASPAR |
| NFE2L1::MafG | 0.0015981 | JASPAR |
| Pax2 | 0.0017062 | JASPAR |
| PPARG | 0.0029619 | JASPAR |
BED file downloads
Top 10 Example Regions
| Location | Gene Link | Dist. |
|---|---|---|
| chr17: 38666520-38666670 | TNS4 | 47.66 |
| chr1: 168688700-168688850 | DPT | 51.77 |
| chr3: 193839880-193840030 | HES1 | 53.94 |
| chr3: 193839880-193840030 | RN7SL215P | 53.94 |
| chr1: 95119700-95119850 | RP11-86H7.7 | 62.65 |
| chr1: 95119700-95119850 | LINC01057 | 62.65 |
| chr19: 39148685-39148835 | CAPN12 | 65.32 |
| chr19: 39148685-39148835 | ACTN4 | 65.32 |
| chr20: 32902265-32902415 | ITCH | 65.63 |
| chr7: 76052625-76052775 | ZP3 | 68.73 |