SOM cluster: 2461
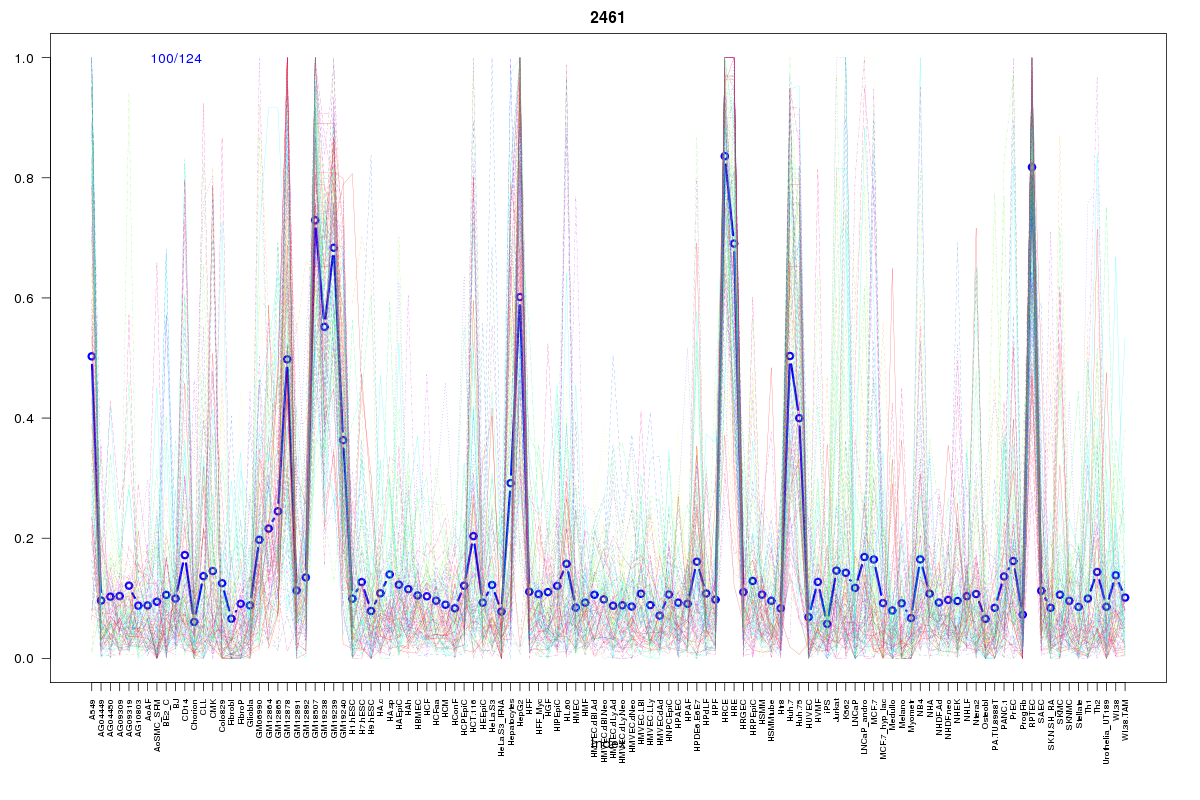
Cluster Hypersensitivity Profile

Genomic Location Trend
These plots show the distribution of the DHS sites surrounding the Transcript Start Site of the nearest gene.
Stats
Number of sites: 124Promoter: 8%
CpG-Island: 2%
Conserved: 43%
Enriched Motifs & Matches
Match Detail: [Jaspar]
|
| ||
|---|---|---|
| Sites: 62/100 | e-val: 0 | ||
| Factor | e-val(match) | DB |
| HNF1A | 0.0000000000000073275 | JASPAR |
| HNF1B | 0.000000000014317 | JASPAR |
| ARID3A | 0.0025863 | JASPAR |
| NR1H2::RXRA | 0.0035152 | JASPAR |
| Lhx3 | 0.0055857 | JASPAR |
BED file downloads
Top 10 Example Regions
| Location | Gene Link | Dist. |
|---|---|---|
| chr8: 121821940-121822090 | SNTB1 | 39.04 |
| chr6: 11217740-11217890 | NEDD9 | 49.47 |
| chr17: 70614385-70614535 | SLC39A11 | 50.94 |
| chr11: 34360880-34361030 | RP1-53C18.3 | 52.65 |
| chr1: 204183040-204183190 | GOLT1A | 53.16 |
| chr11: 75497580-75497730 | DGAT2 | 54.36 |
| chr5: 176805960-176806110 | RAB24 | 56.53 |
| chr13: 47182000-47182150 | LRCH1 | 61.43 |
| chr17: 46639740-46639890 | HOXB-AS3 | 62.11 |
| chr5: 1106080-1106230 | SLC12A7 | 62.38 |