SOM cluster: 3
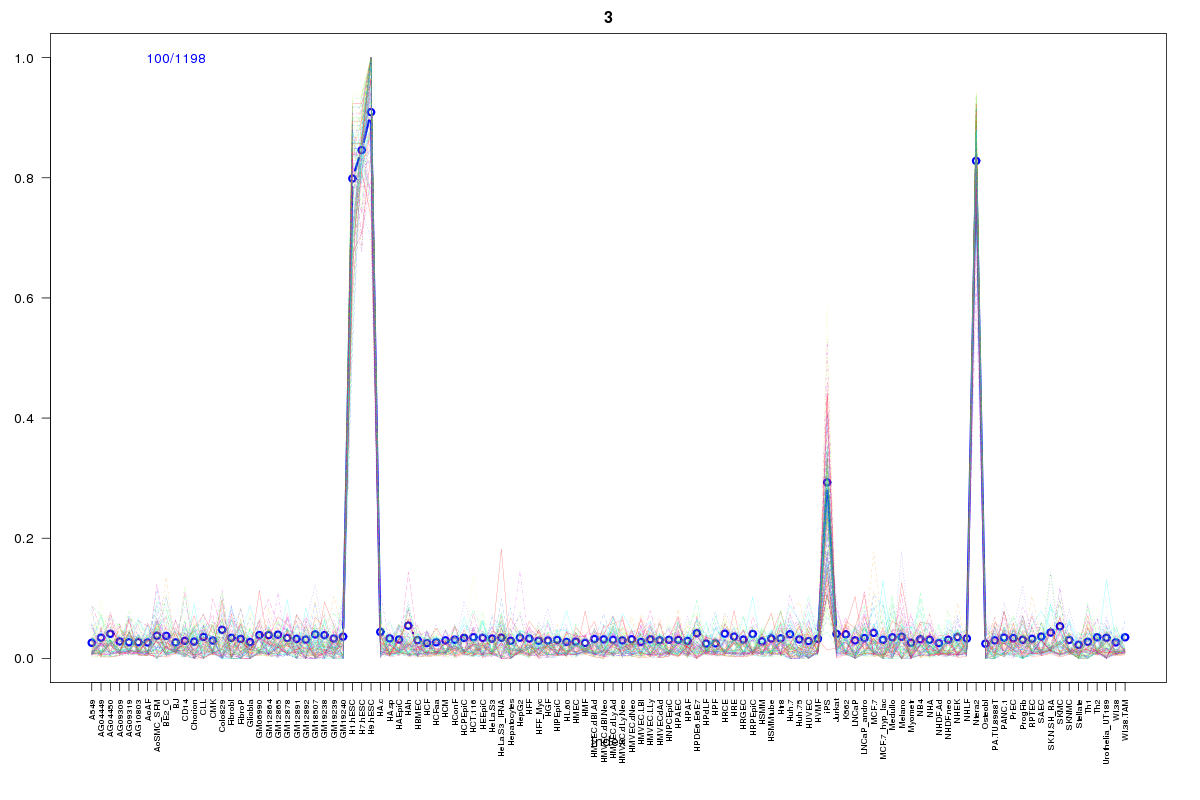
Cluster Hypersensitivity Profile

Genomic Location Trend
These plots show the distribution of the DHS sites surrounding the Transcript Start Site of the nearest gene.
Stats
Number of sites: 1198Promoter: 0%
CpG-Island: 0%
Conserved: 27%
Enriched Motifs & Matches
Match Detail: [Jaspar]
|
| ||
|---|---|---|
| Sites: 19/100 | e-val: 0.0019 | ||
| Factor | e-val(match) | DB |
| Pou5f1 | 2.2204e-16 | JASPAR |
| Sox2 | 0.0000000000000084377 | JASPAR |
| SOX10 | 0.0016128 | JASPAR |
| SOX9 | 0.0042641 | JASPAR |
| Pdx1 | 0.0070539 | JASPAR |
BED file downloads
Top 10 Example Regions
| Location | Gene Link | Dist. |
|---|---|---|
| chr1: 203965860-203966010 | SOX13 | 35.49 |
| chr6: 125849880-125850030 | RP11-624M8.1 | 40.5 |
| chr12: 9064560-9064710 | A2ML1-AS2 | 42.71 |
| chr12: 9064560-9064710 | PHC1 | 42.71 |
| chr12: 9064560-9064710 | KLRG1 | 42.71 |
| chr11: 131123140-131123290 | AP002856.5 | 47.98 |
| chr10: 21762180-21762330 | SKIDA1 | 49.24 |
| chr2: 152265400-152265550 | RIF1 | 53.82 |
| chr5: 141252500-141252650 | AC005740.5 | 53.84 |
| chr1: 230563840-230563990 | PGBD5 | 55.67 |