SOM cluster: 337
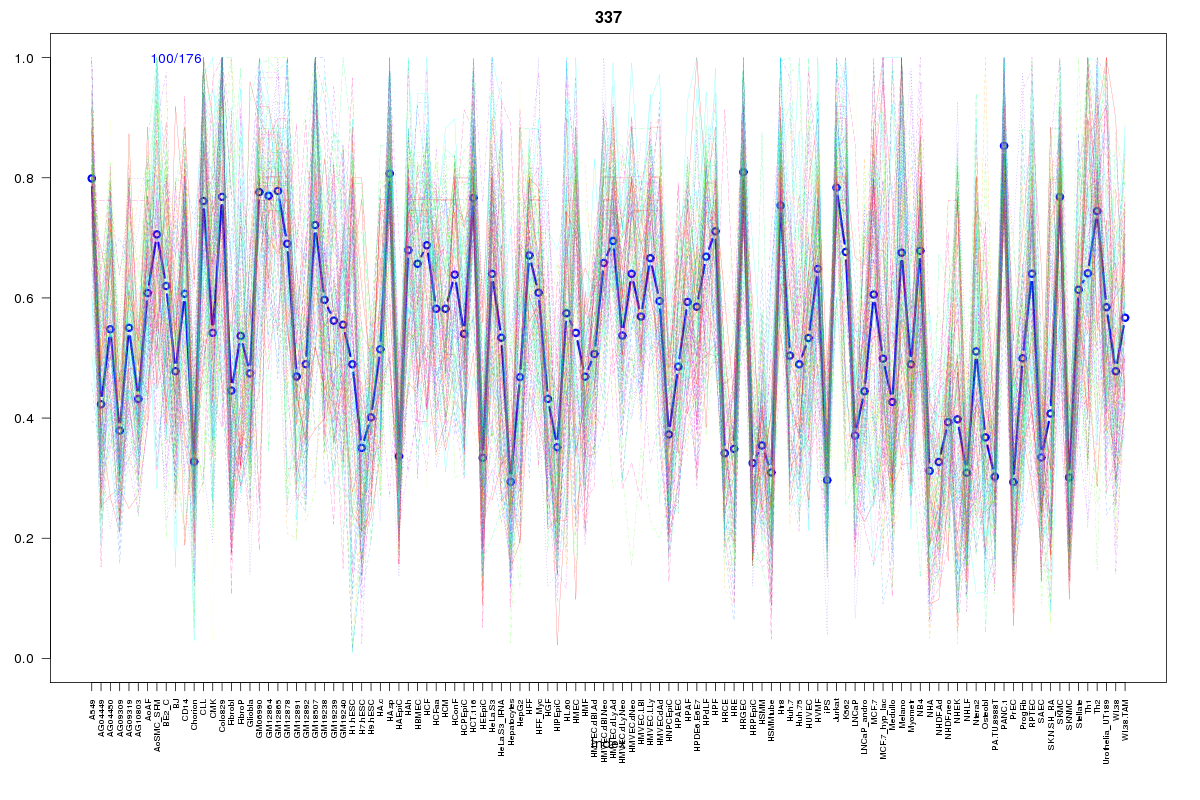
Cluster Hypersensitivity Profile

Genomic Location Trend
These plots show the distribution of the DHS sites surrounding the Transcript Start Site of the nearest gene.
Stats
Number of sites: 176Promoter: 51%
CpG-Island: 19%
Conserved: 73%
Enriched Motifs & Matches
Match Detail: [Jaspar]
|
| ||
|---|---|---|
| Sites: 20/100 | e-val: 0.0000000000016 | ||
| Factor | e-val(match) | DB |
| CTCF | 0.0000000000000015543 | JASPAR |
| NFATC2 | 0.00056867 | JASPAR |
| SRF | 0.0034883 | JASPAR |
| TAL1::TCF3 | 0.0043706 | JASPAR |
| Zfp423 | 0.0078227 | JASPAR |
|
| ||
| Sites: 41/100 | e-val: 0.000000085 | ||
| Factor | e-val(match) | DB |
| IRF1 | 0.00078293 | JASPAR |
| NFATC2 | 0.0021298 | JASPAR |
| FOXA1 | 0.0022266 | JASPAR |
| Foxa2 | 0.0024001 | JASPAR |
| IRF2 | 0.0041034 | JASPAR |
BED file downloads
Top 10 Example Regions
| Location | Gene Link | Dist. |
|---|---|---|
| chr1: 145507780-145507930 | PEX11B | 13.92 |
| chr1: 145507780-145507930 | NUDT17 | 13.92 |
| chr1: 204475540-204475690 | PIK3C2B | 39.09 |
| chr3: 169489900-169490050 | LRRC31 | 41.33 |
| chr1: 169763780-169763930 | C1orf112 | 50.76 |
| chr1: 169763780-169763930 | METTL18 | 50.76 |
| chr1: 169763780-169763930 | SCYL3 | 50.76 |
| chr6: 52281460-52281610 | PAQR8 | 56.67 |
| chr12: 98897360-98897510 | SLC25A3 | 60.71 |
| chr12: 98897360-98897510 | TMPO-AS1 | 60.71 |