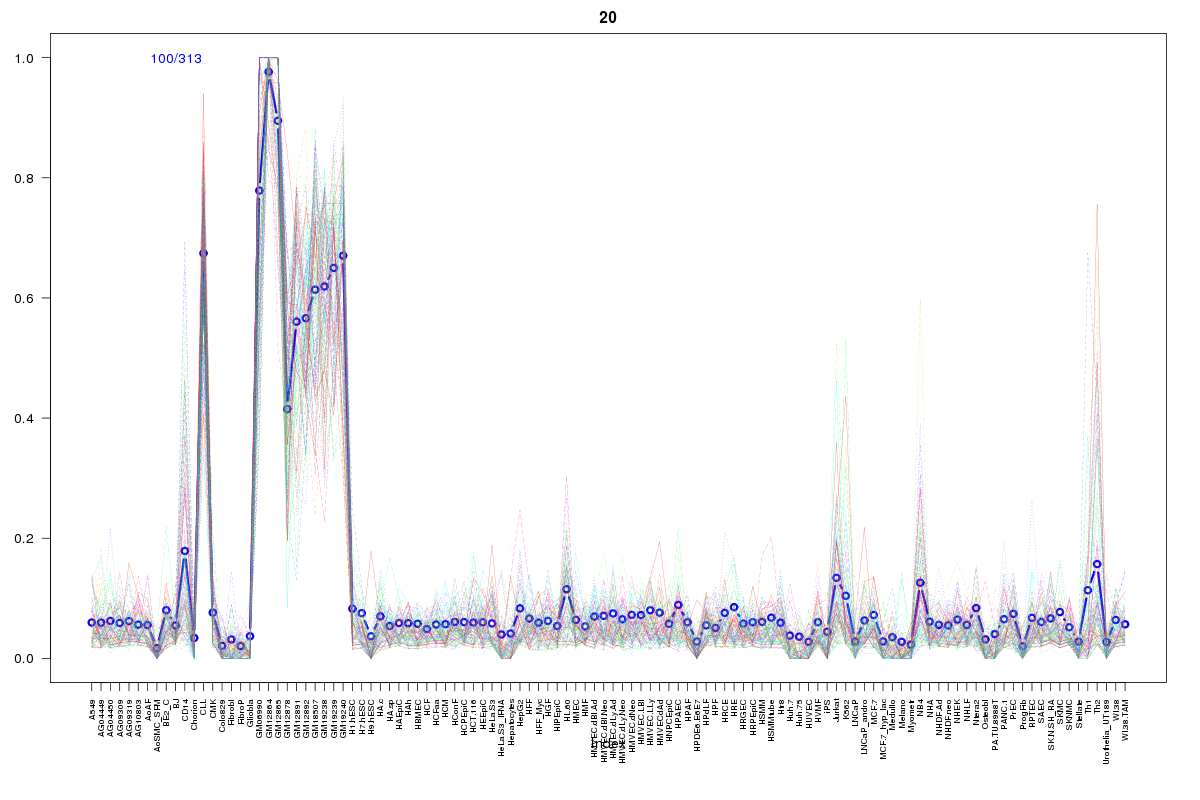
Gene: PIK3C2B
chr1: 204391755-204459552Expression Profile
(log scale)
Graphical Connections
Distribution of linked clusters:
You may find it interesting if many of the connected DHS sites belong to the same cluster.| Cluster Profile | Cluster ID | Number of DHS sites in this cluster |
|---|---|---|
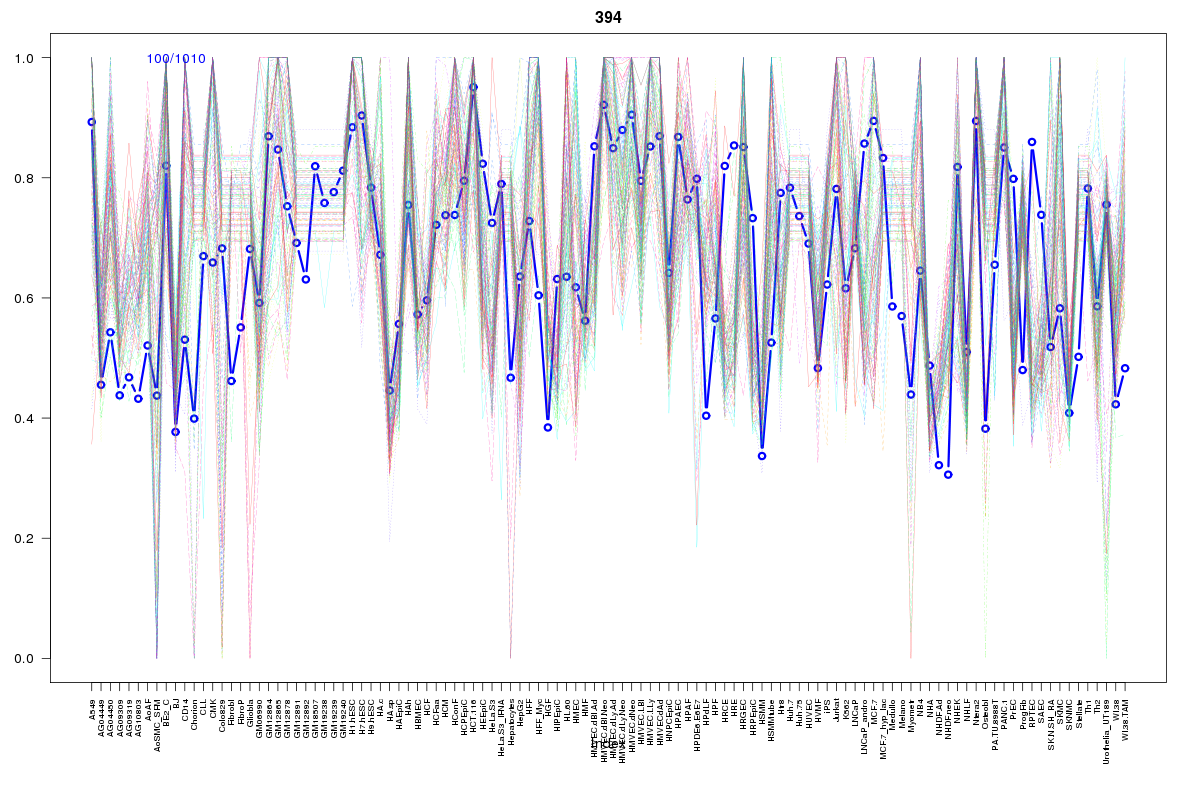 | 394 | 3 |
 | 687 | 3 |
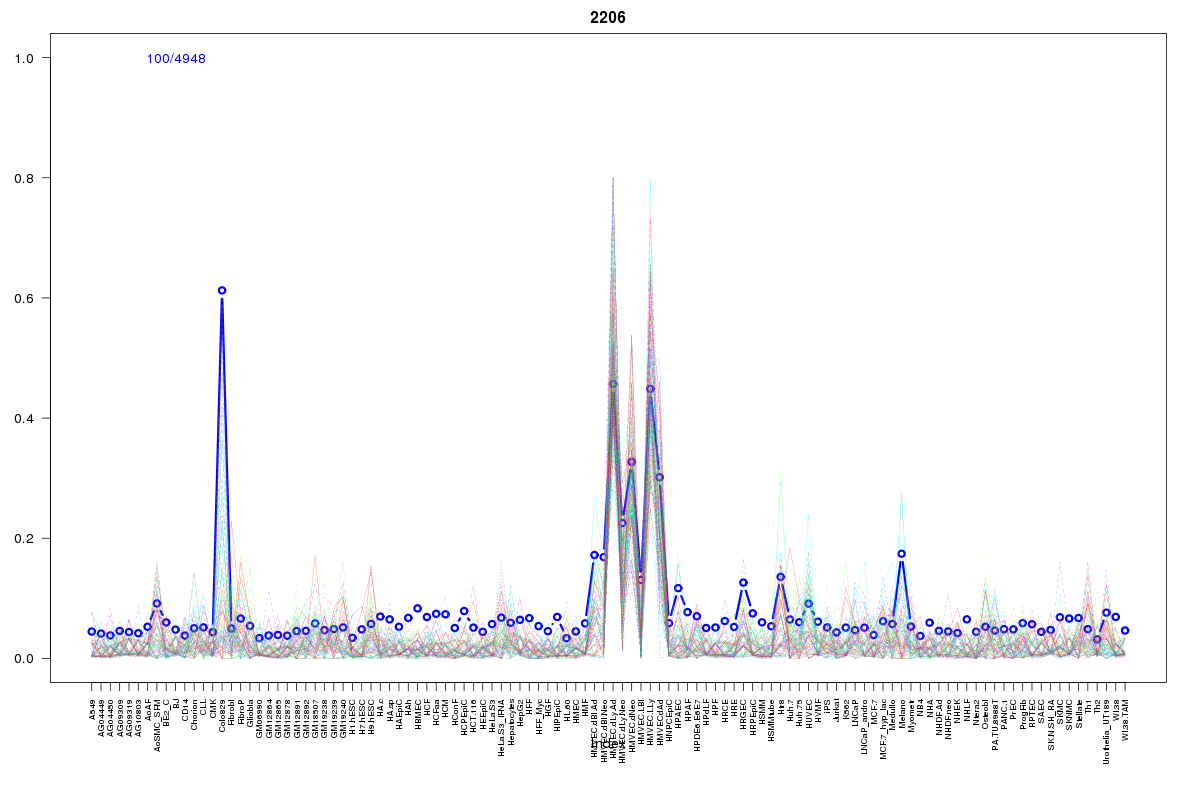 | 2206 | 2 |
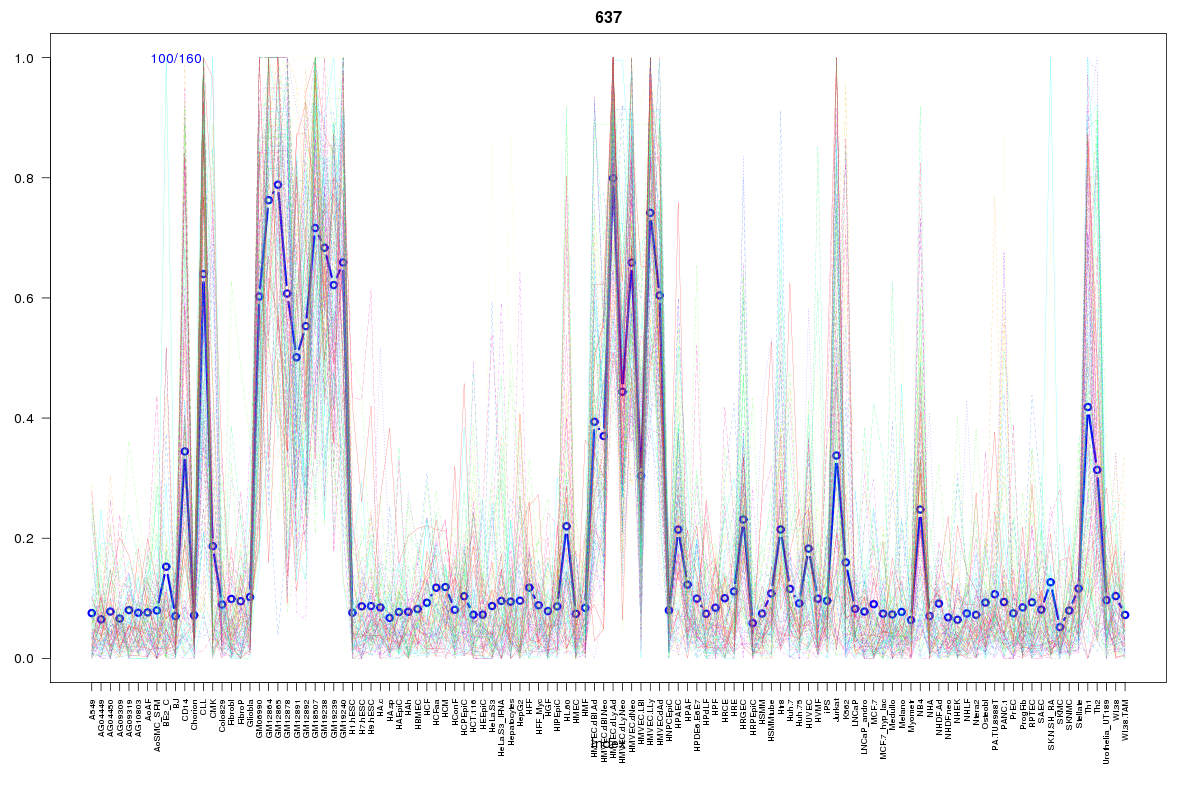 | 637 | 1 |
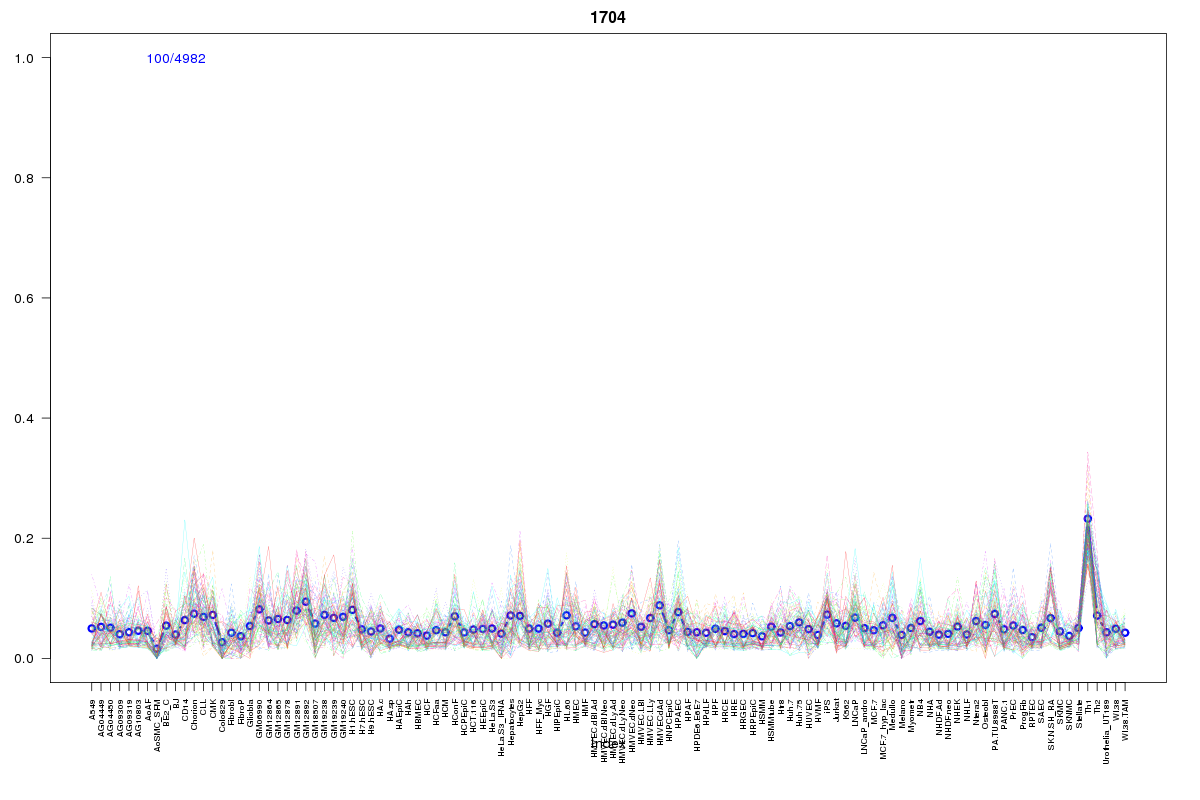 | 1704 | 1 |
 | 2011 | 1 |
 | 534 | 1 |
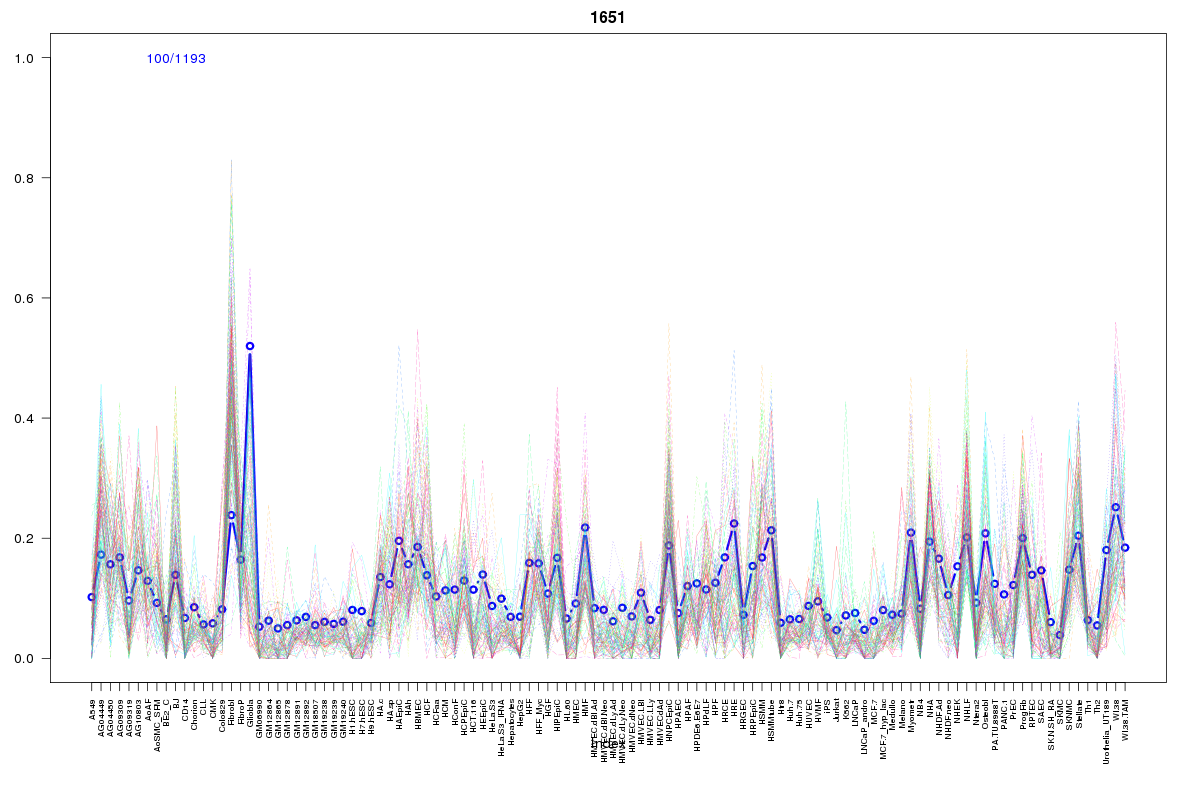 | 1651 | 1 |
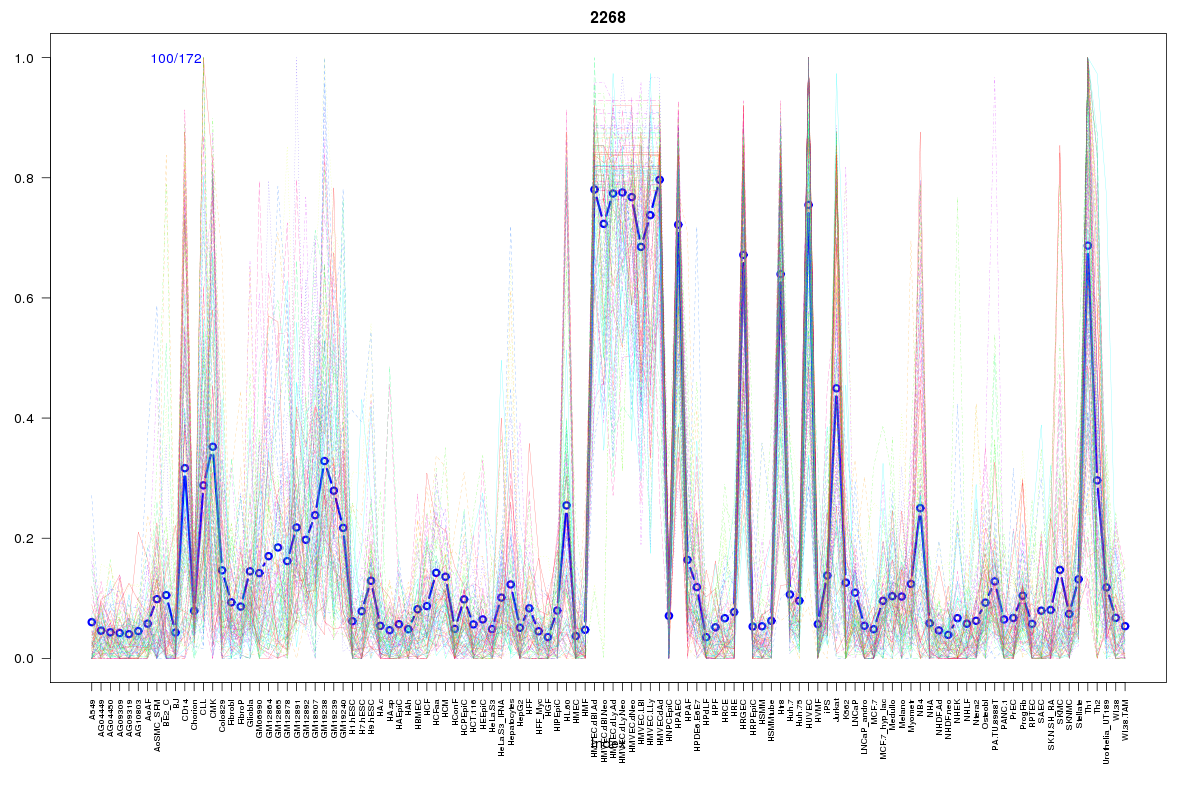 | 2268 | 1 |
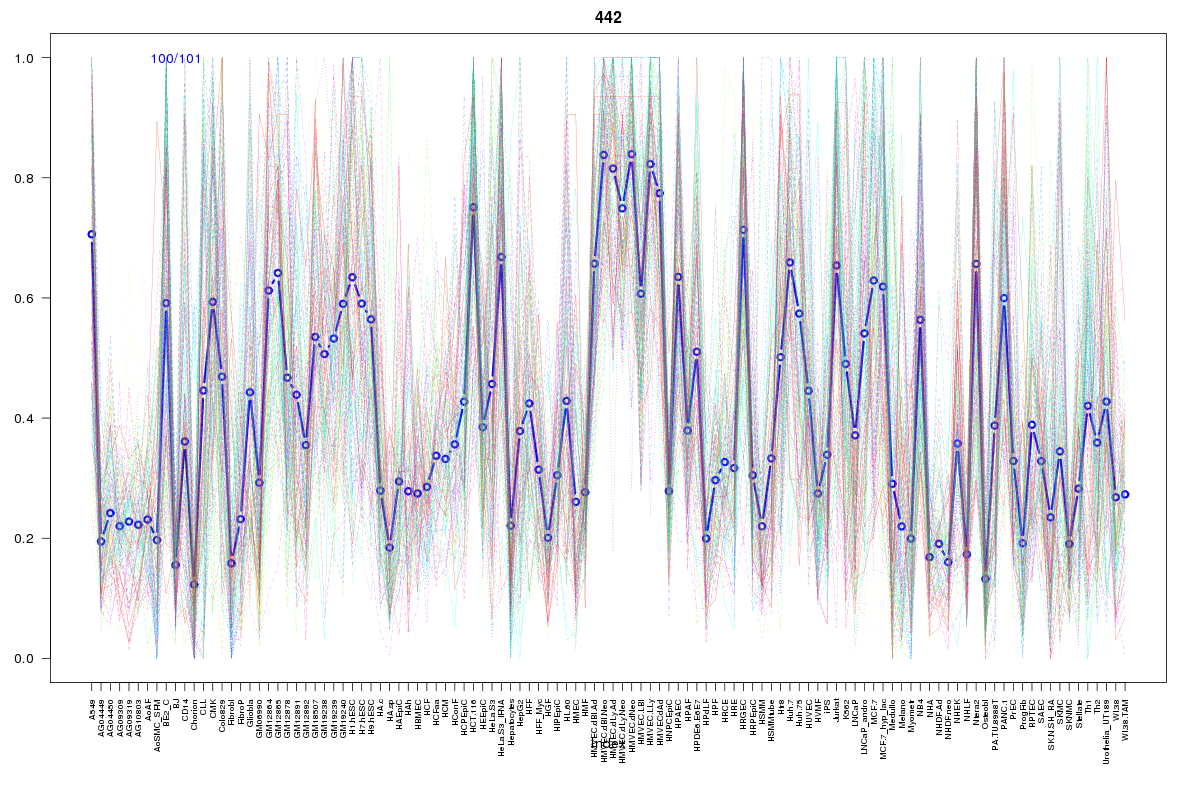 | 442 | 1 |
 | 77 | 1 |
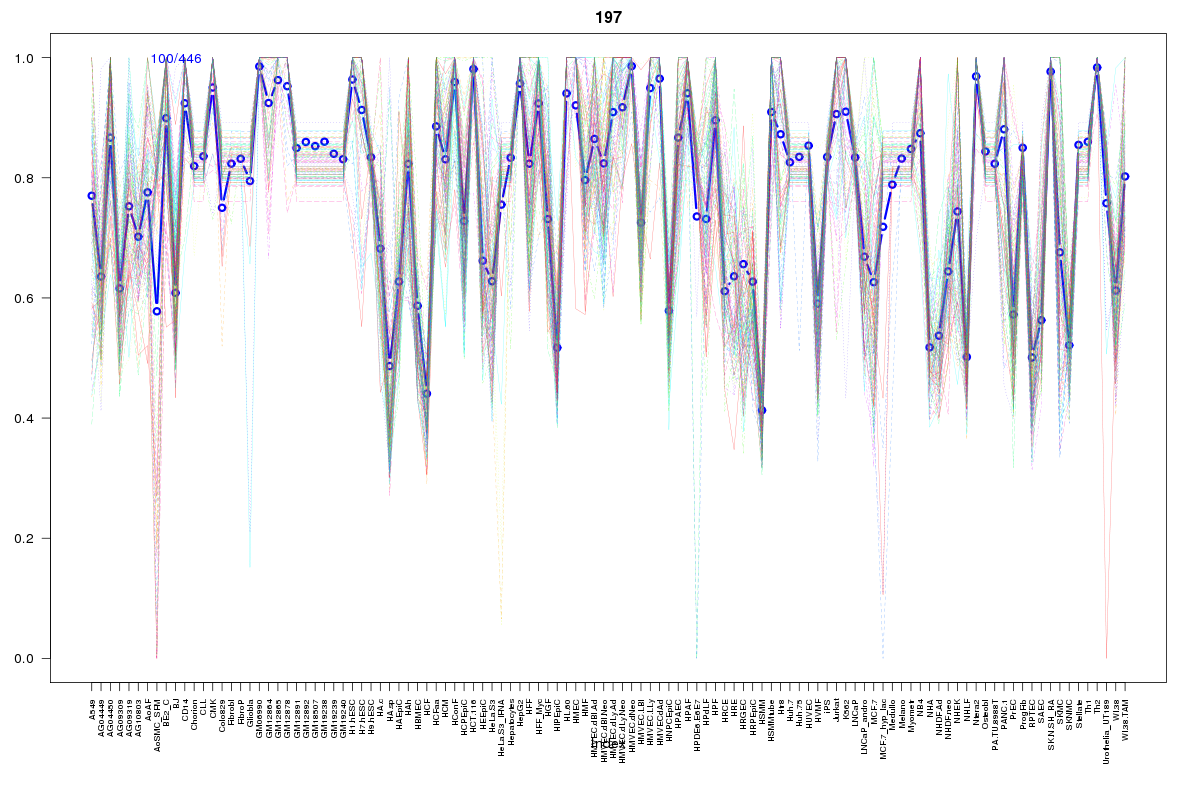 | 197 | 1 |
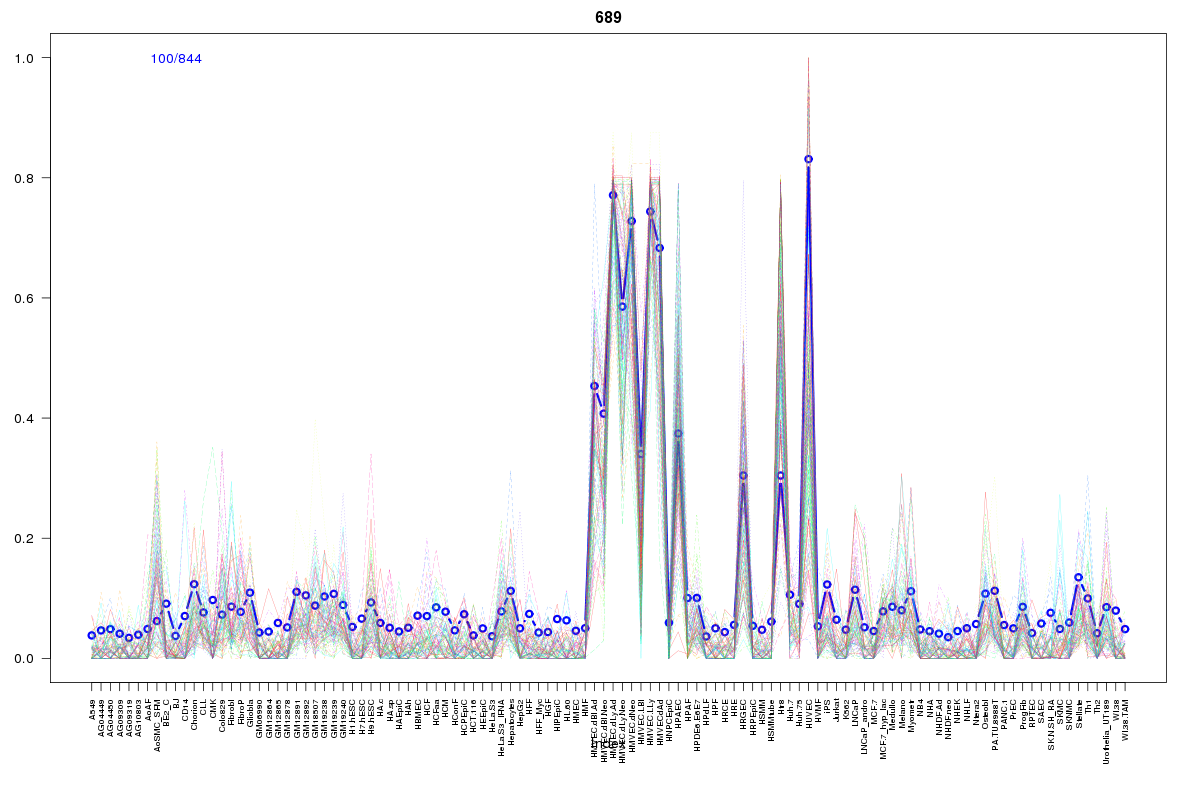 | 689 | 1 |
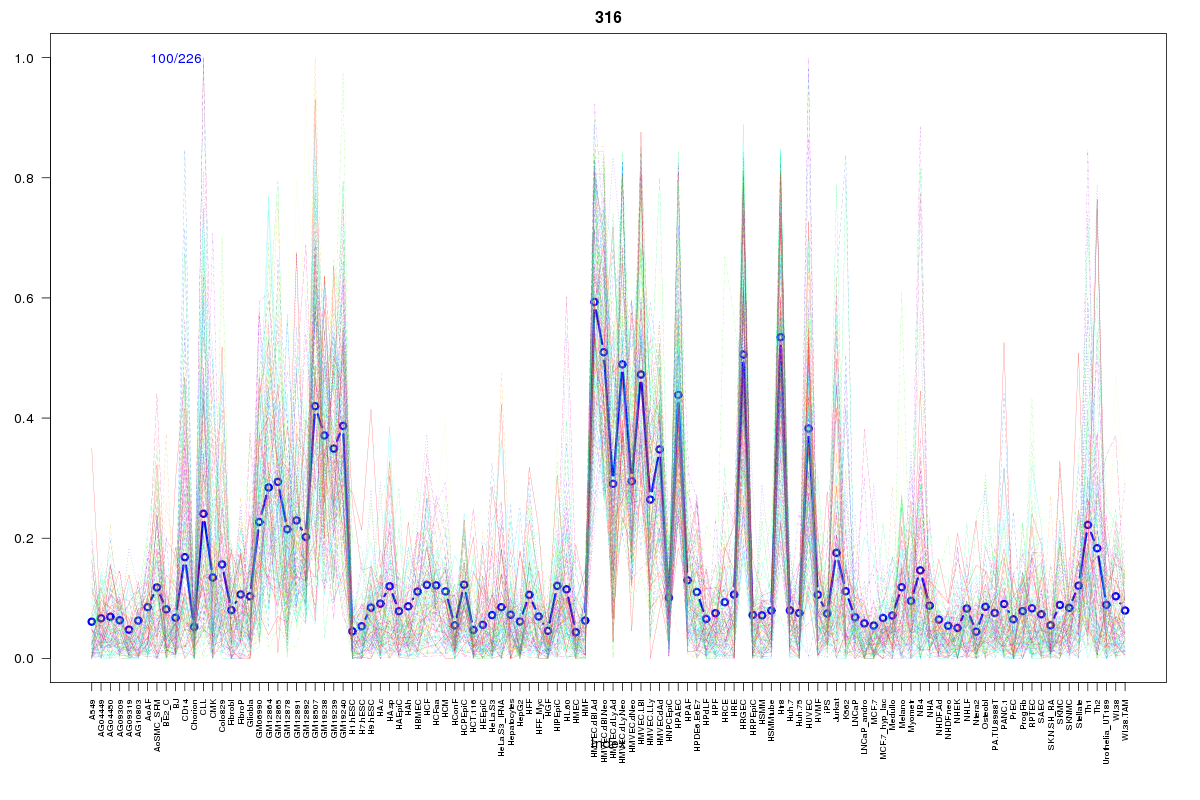 | 316 | 1 |
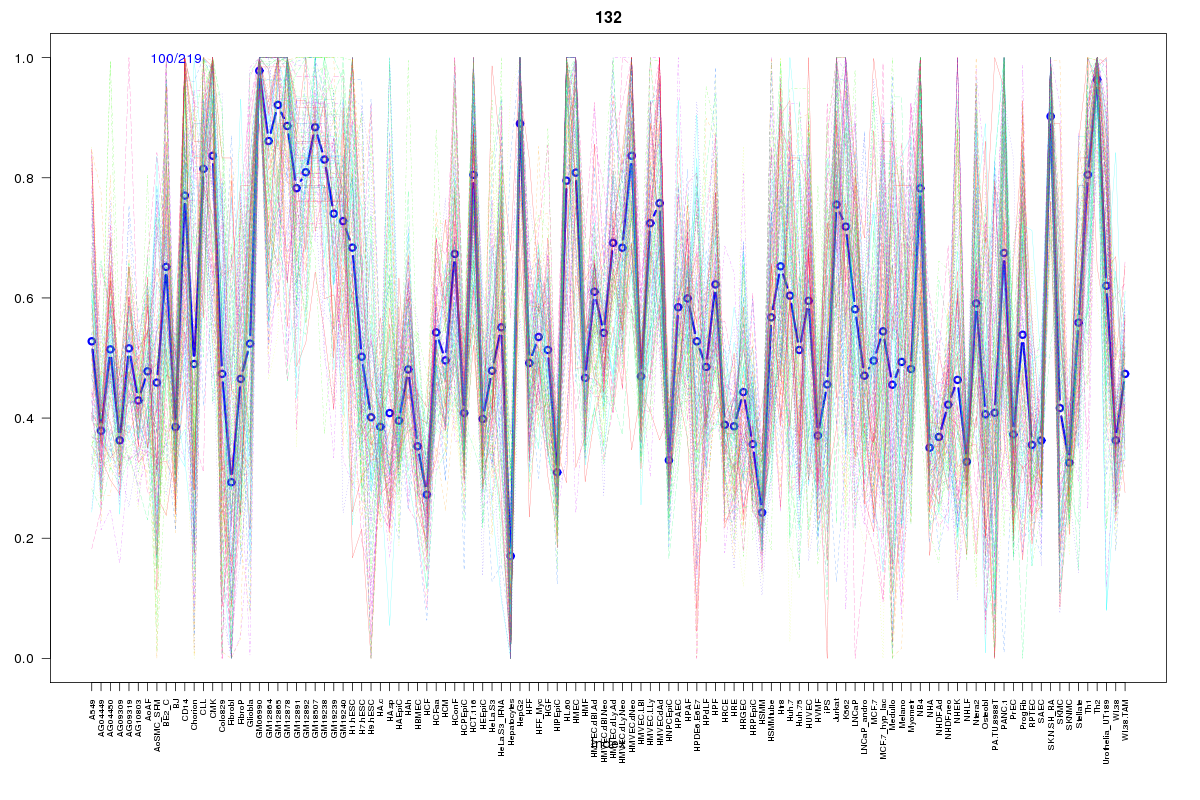 | 132 | 1 |
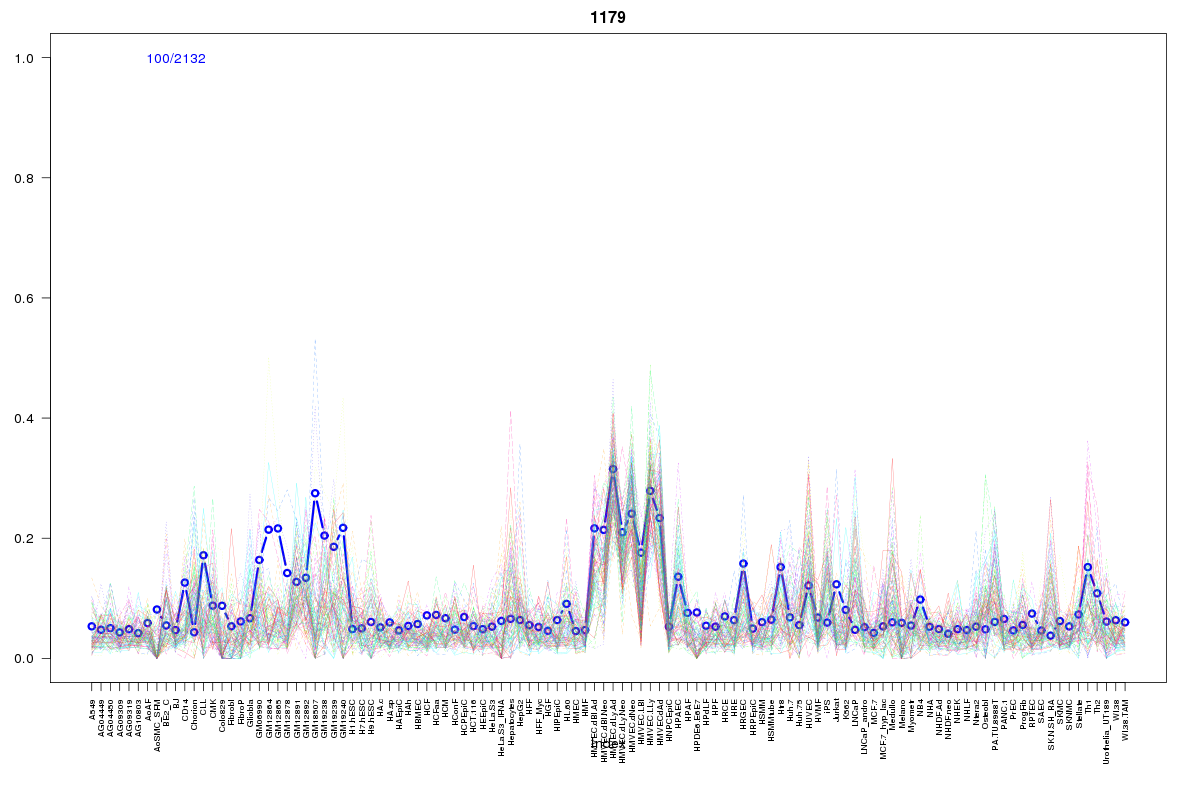 | 1179 | 1 |
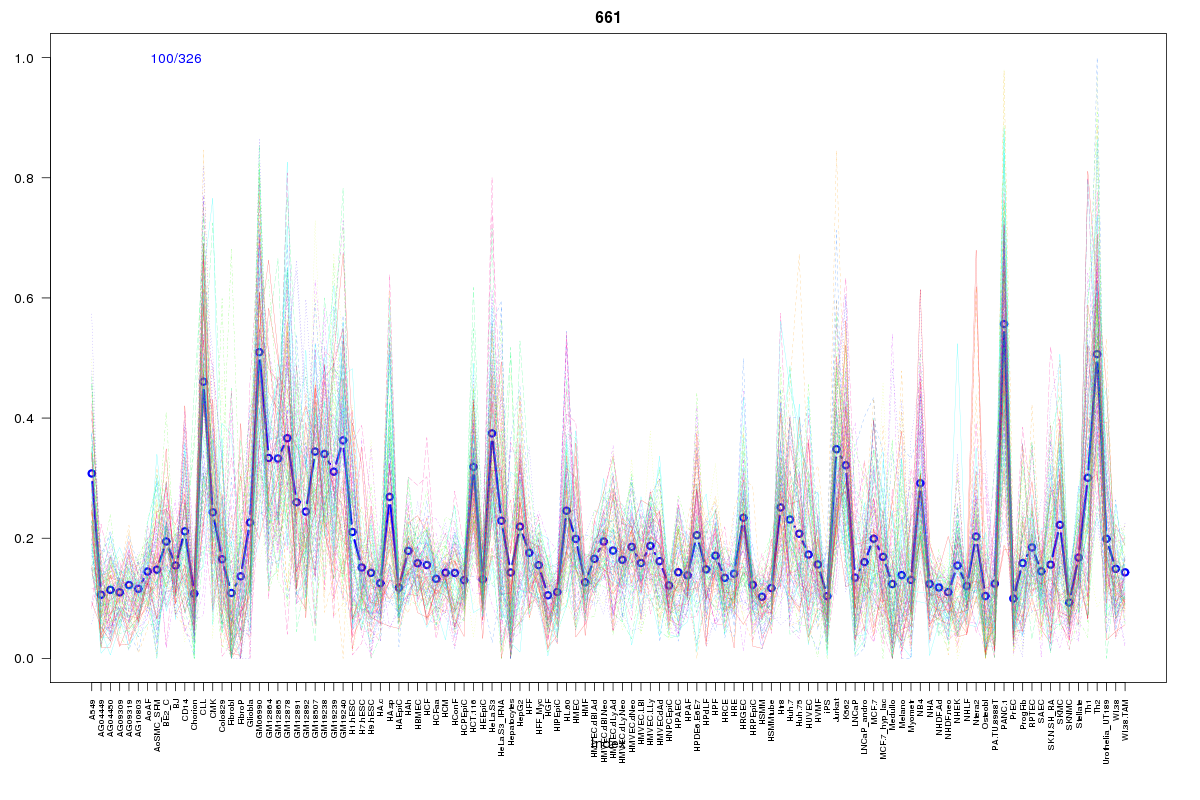 | 661 | 1 |
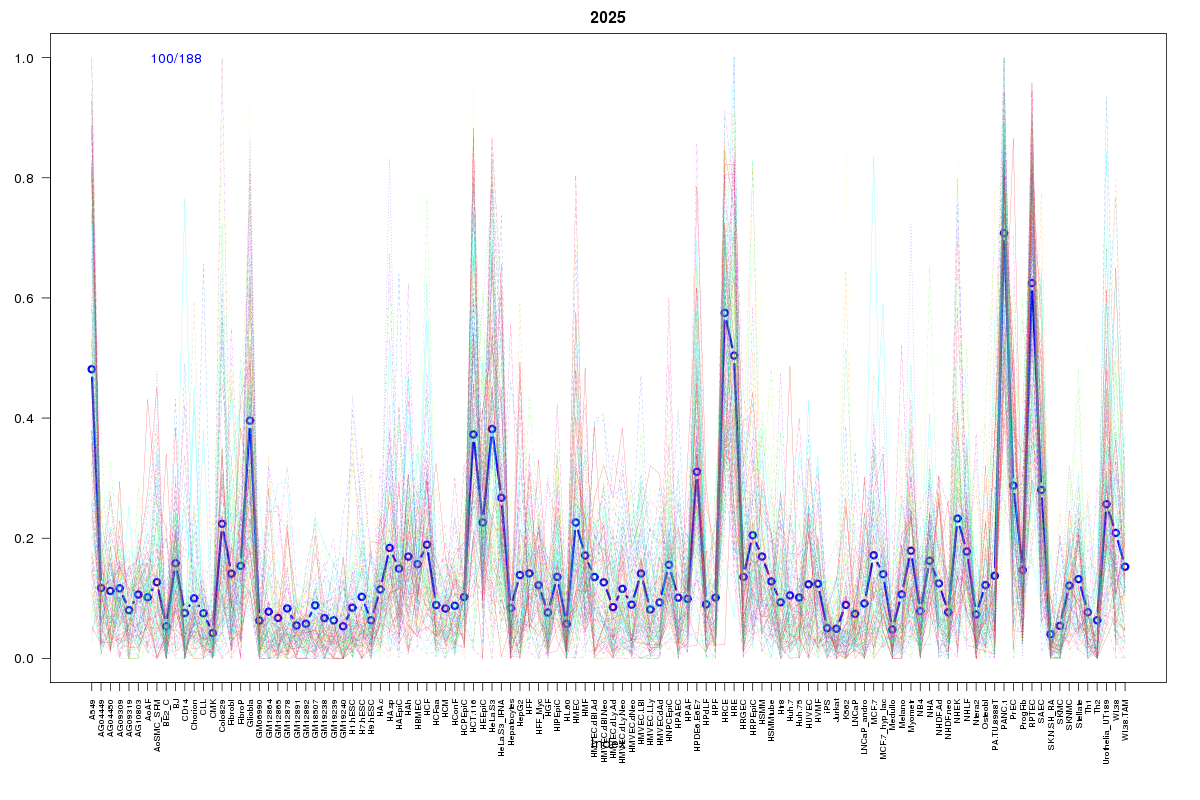 | 2025 | 1 |
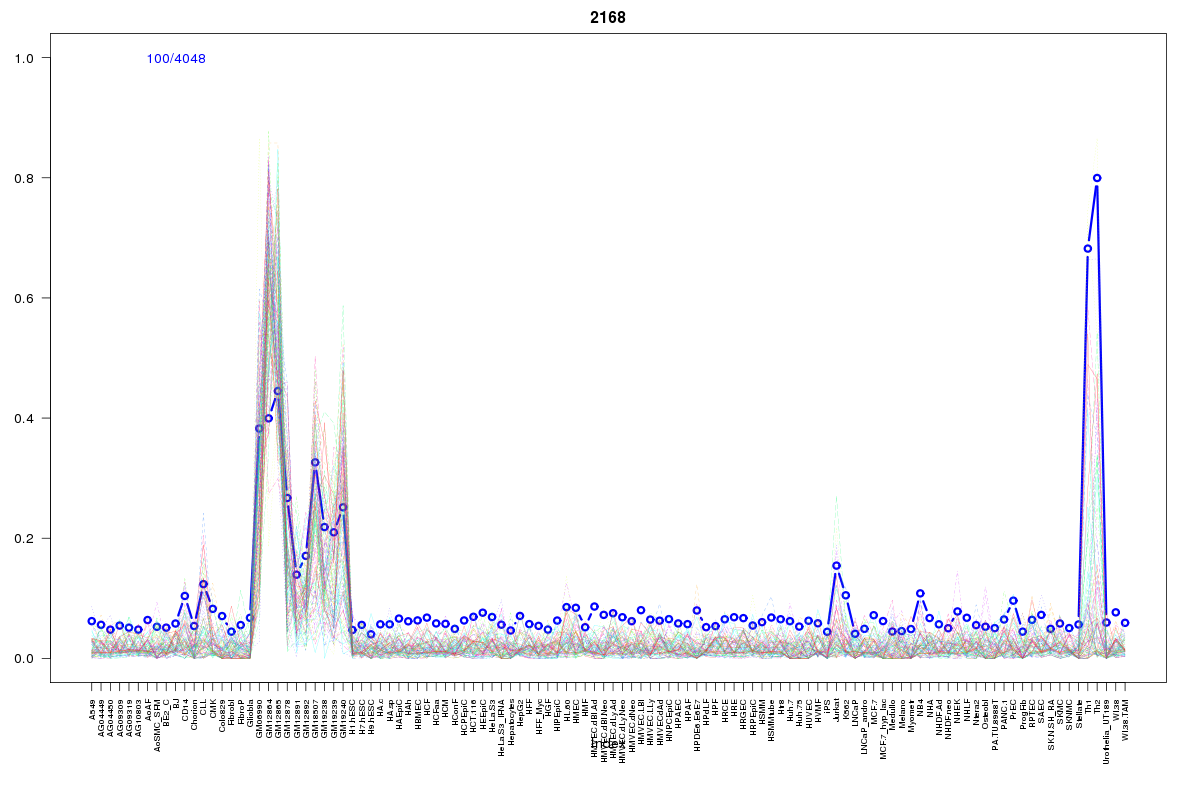 | 2168 | 1 |
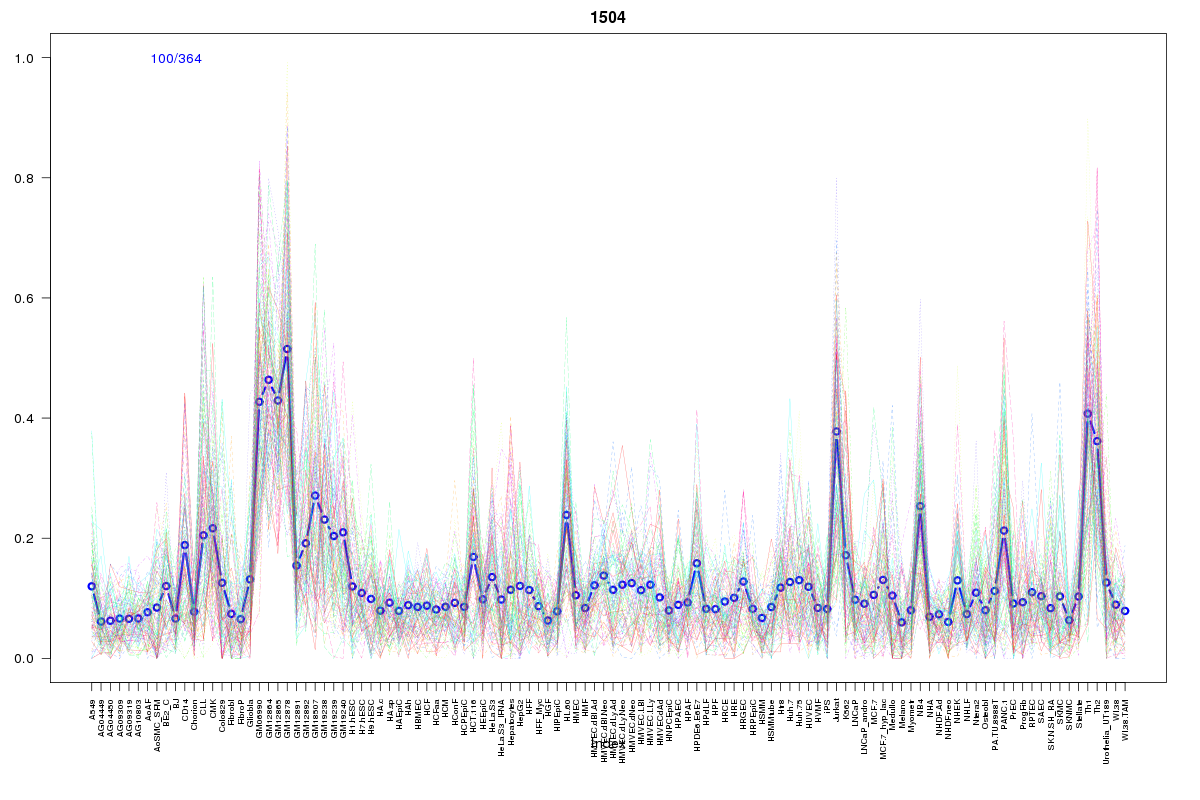 | 1504 | 1 |
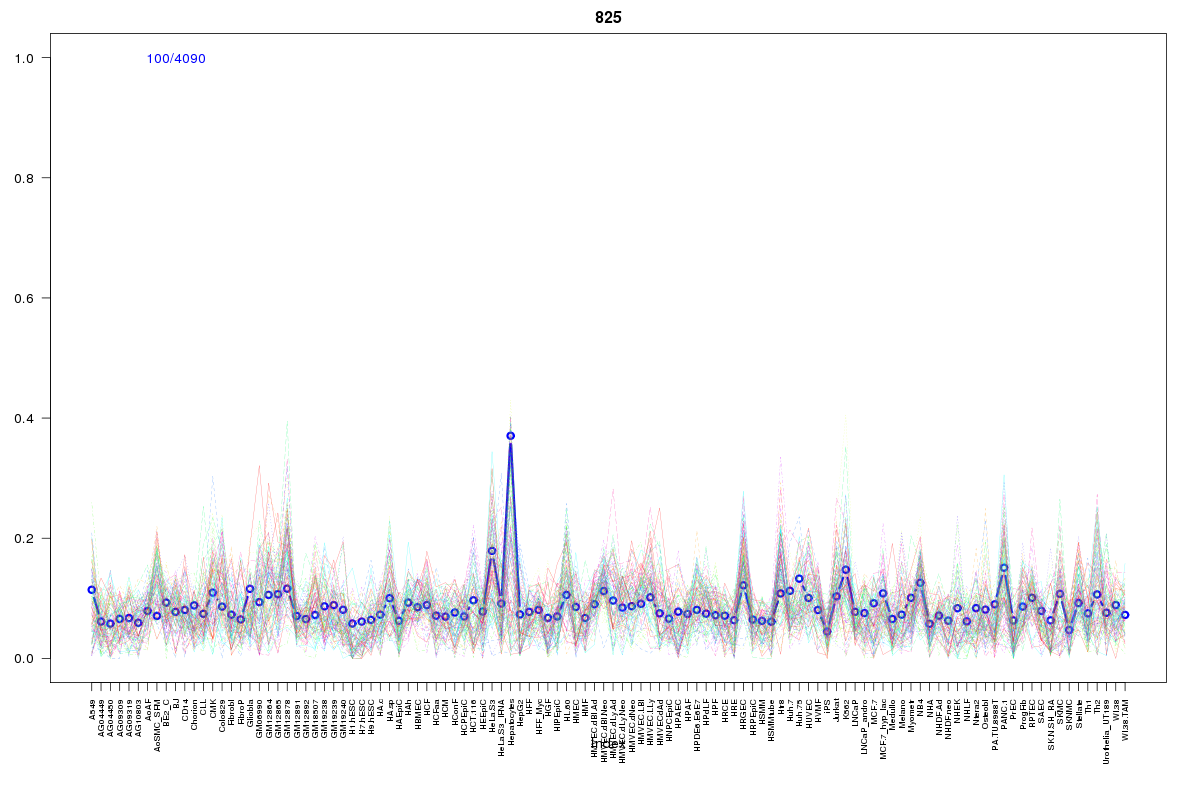 | 825 | 1 |
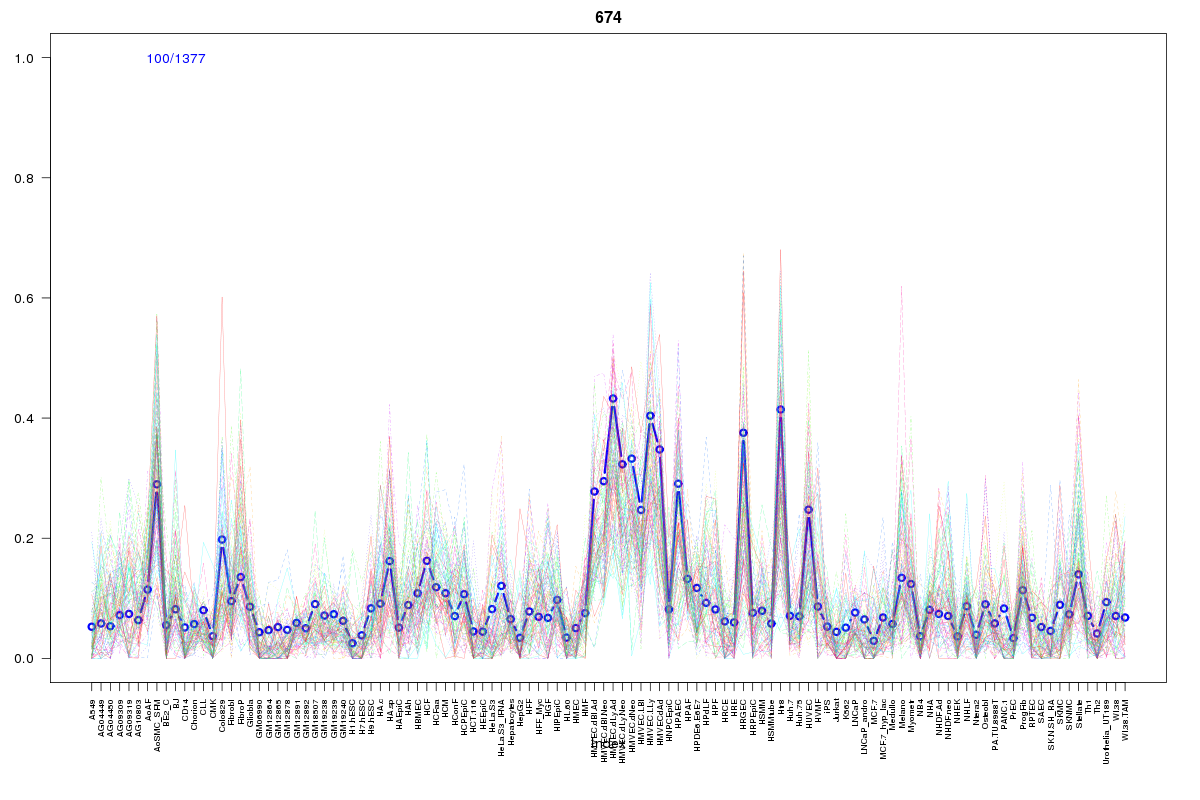 | 674 | 1 |
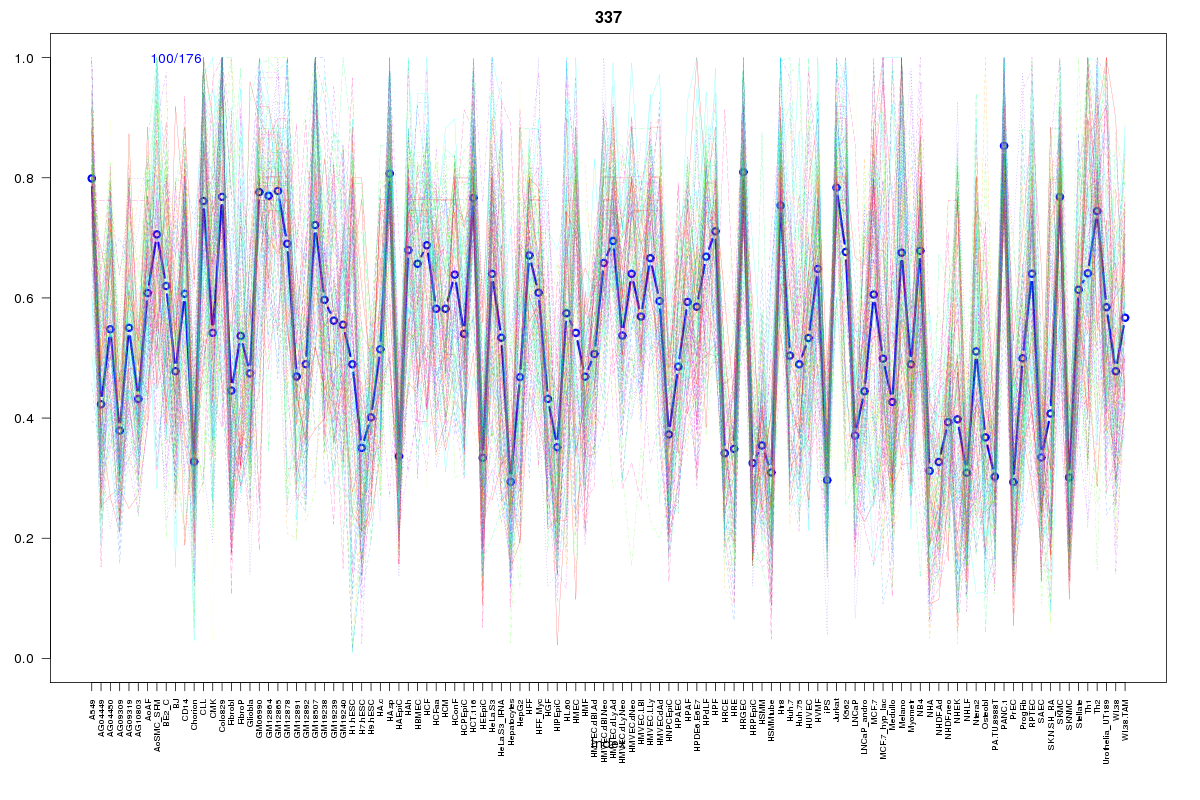 | 337 | 1 |
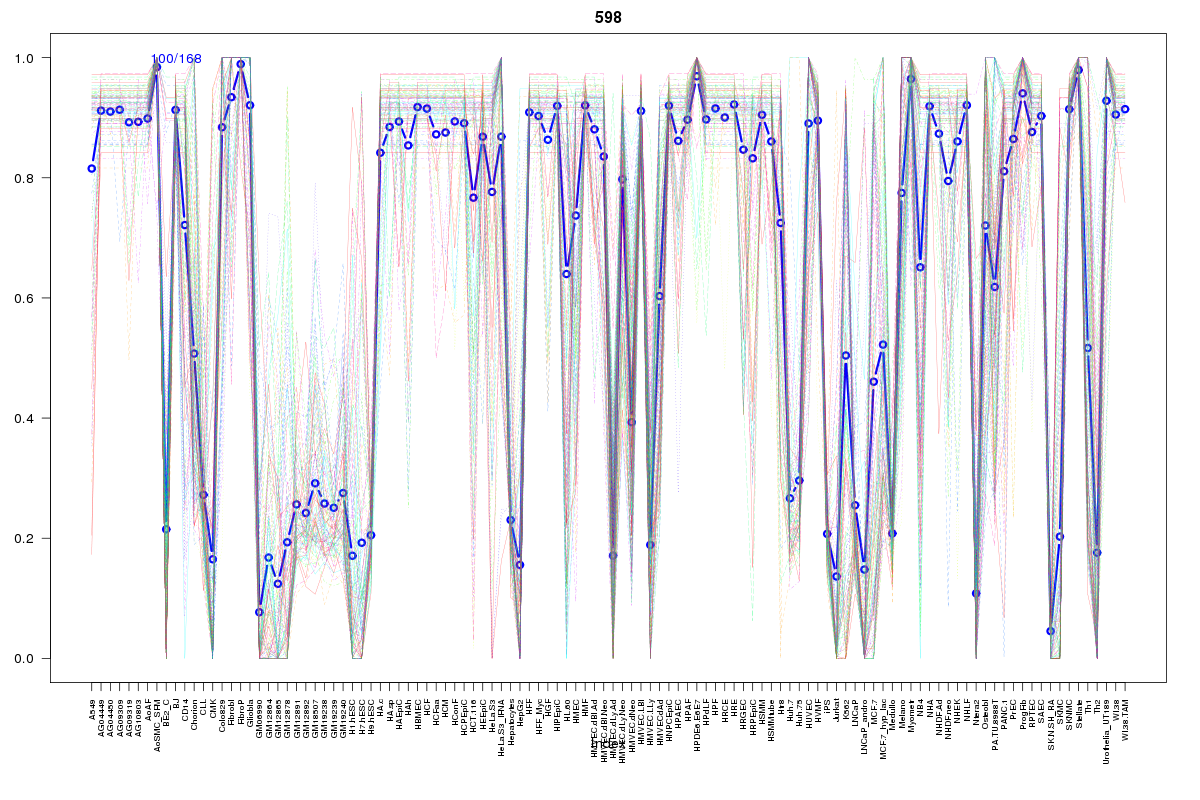 | 598 | 1 |
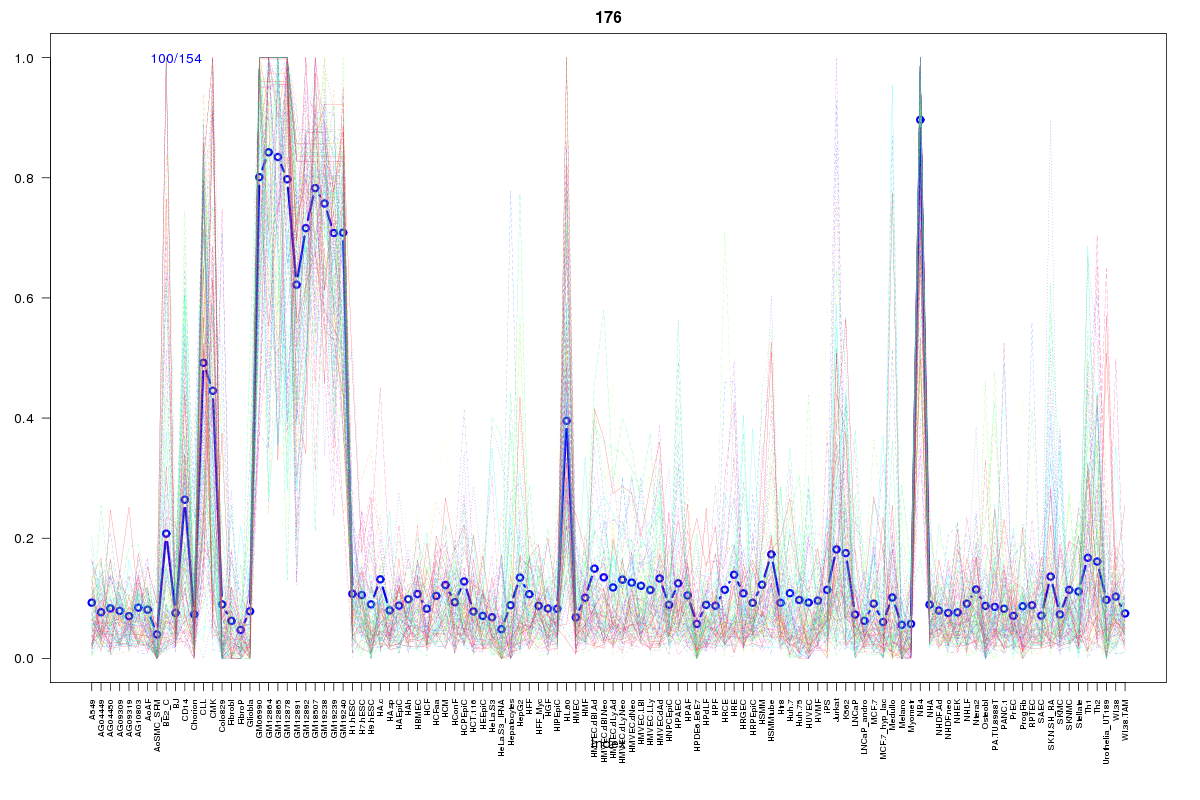 | 176 | 1 |
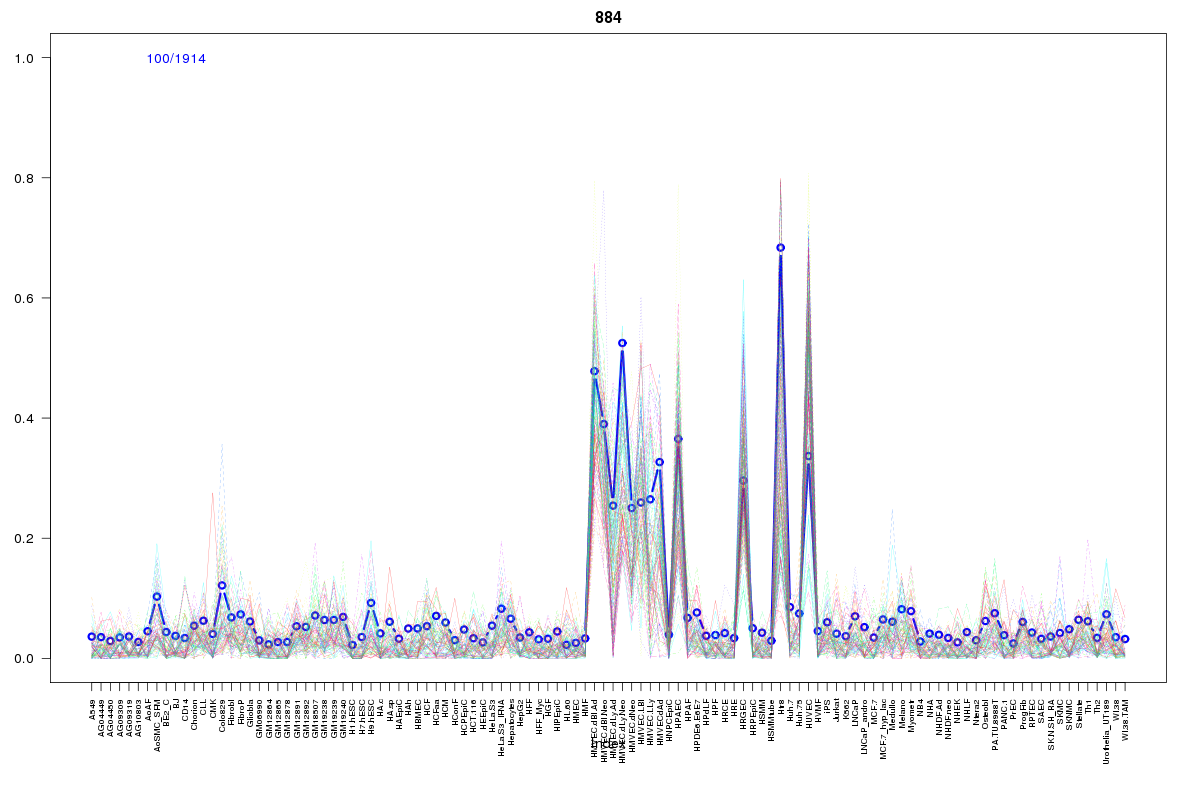 | 884 | 1 |
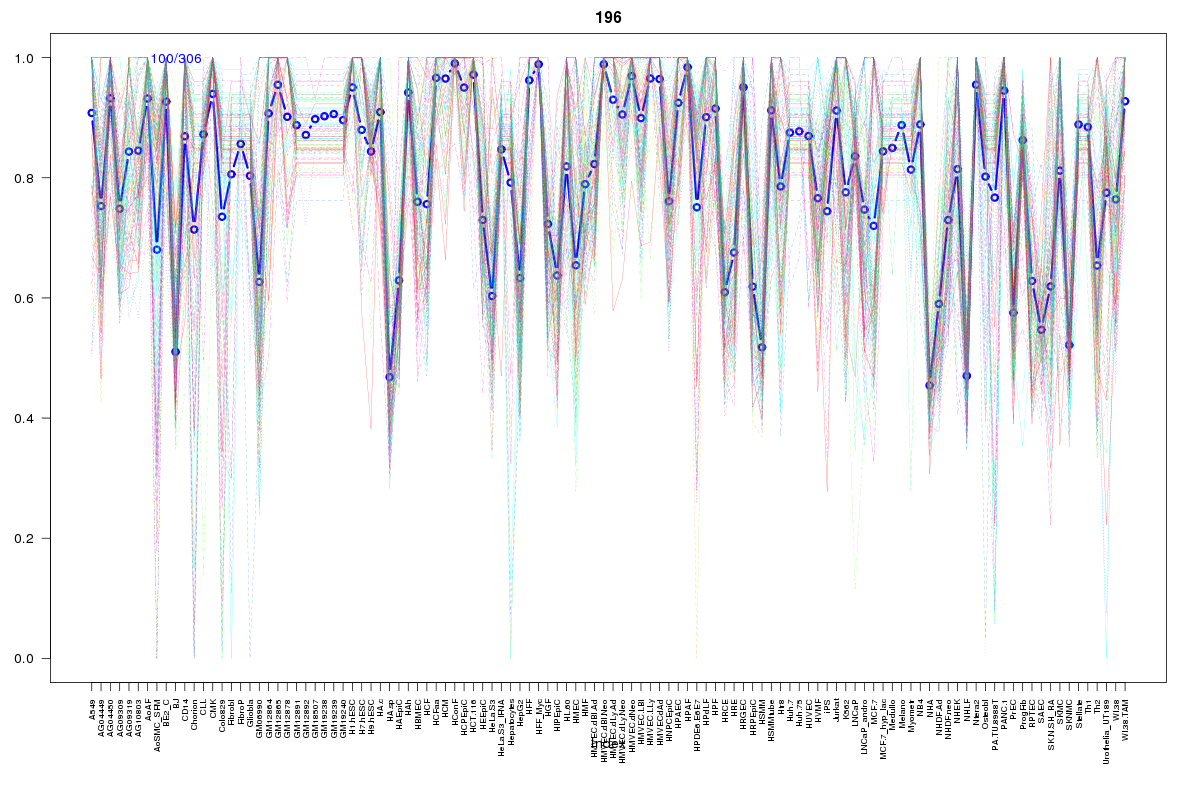 | 196 | 1 |
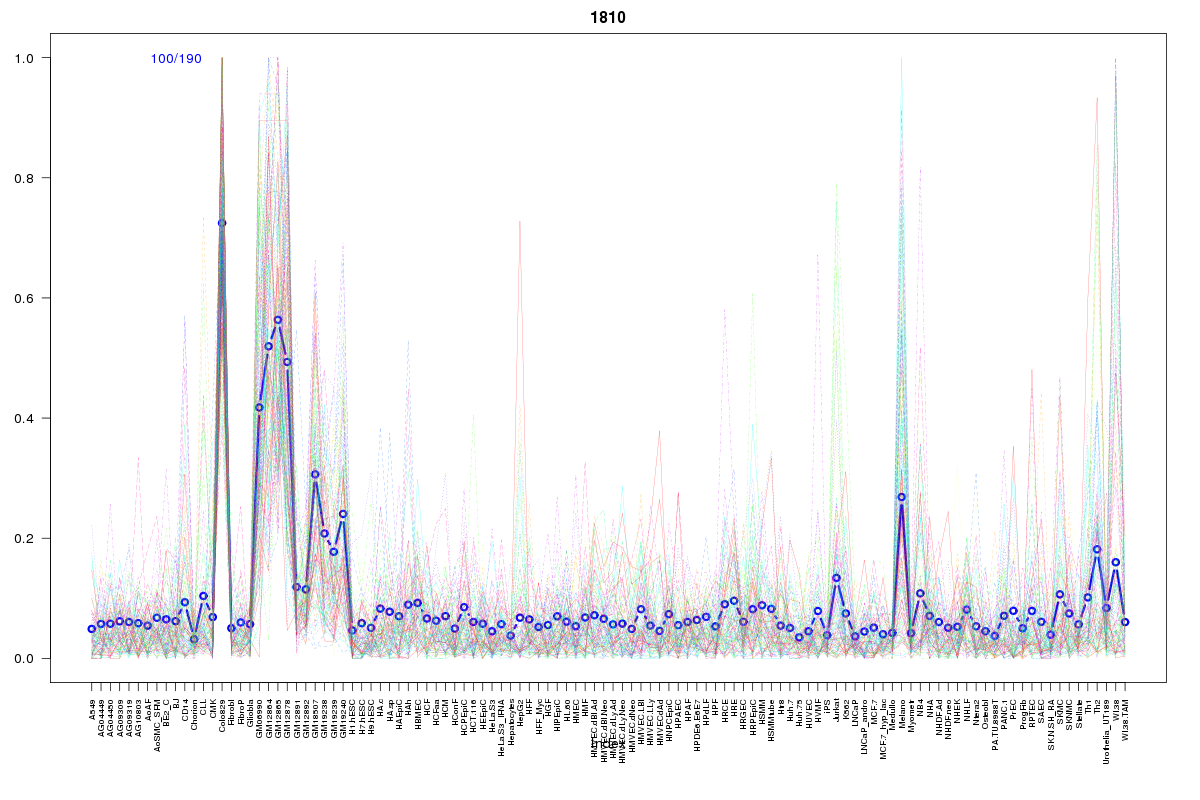 | 1810 | 1 |
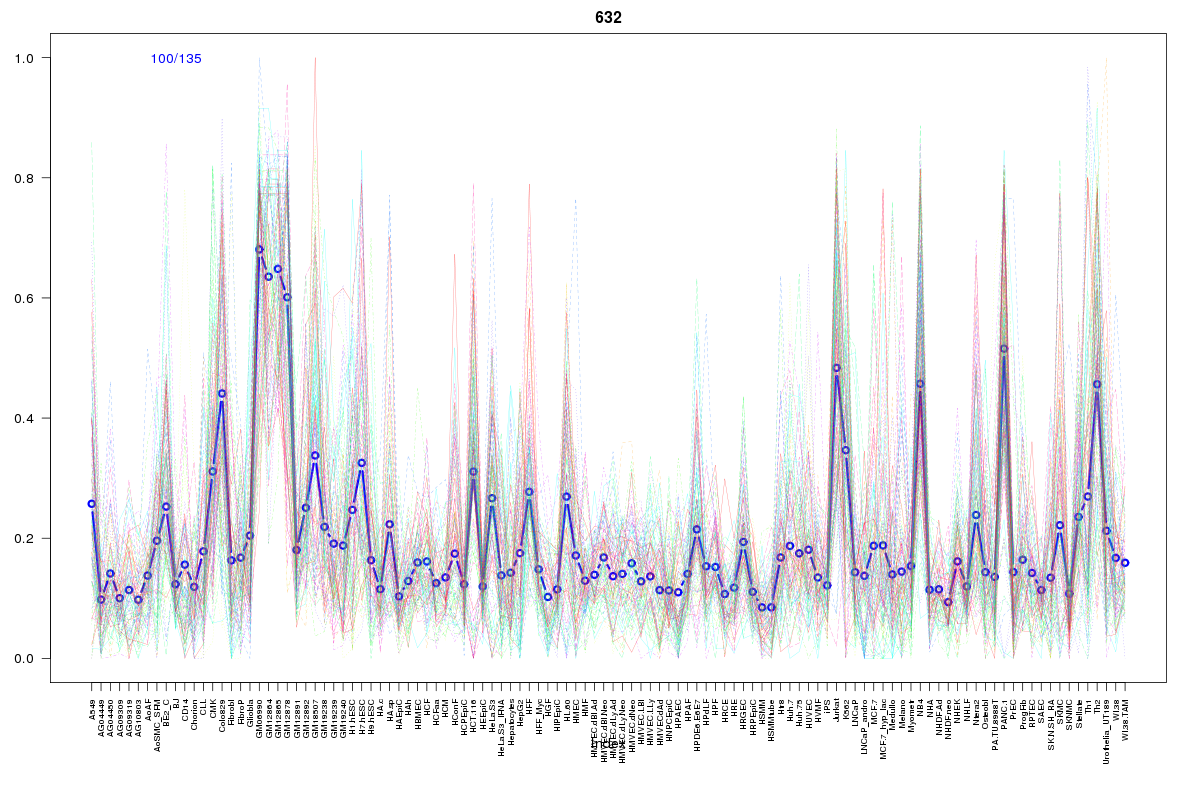 | 632 | 1 |
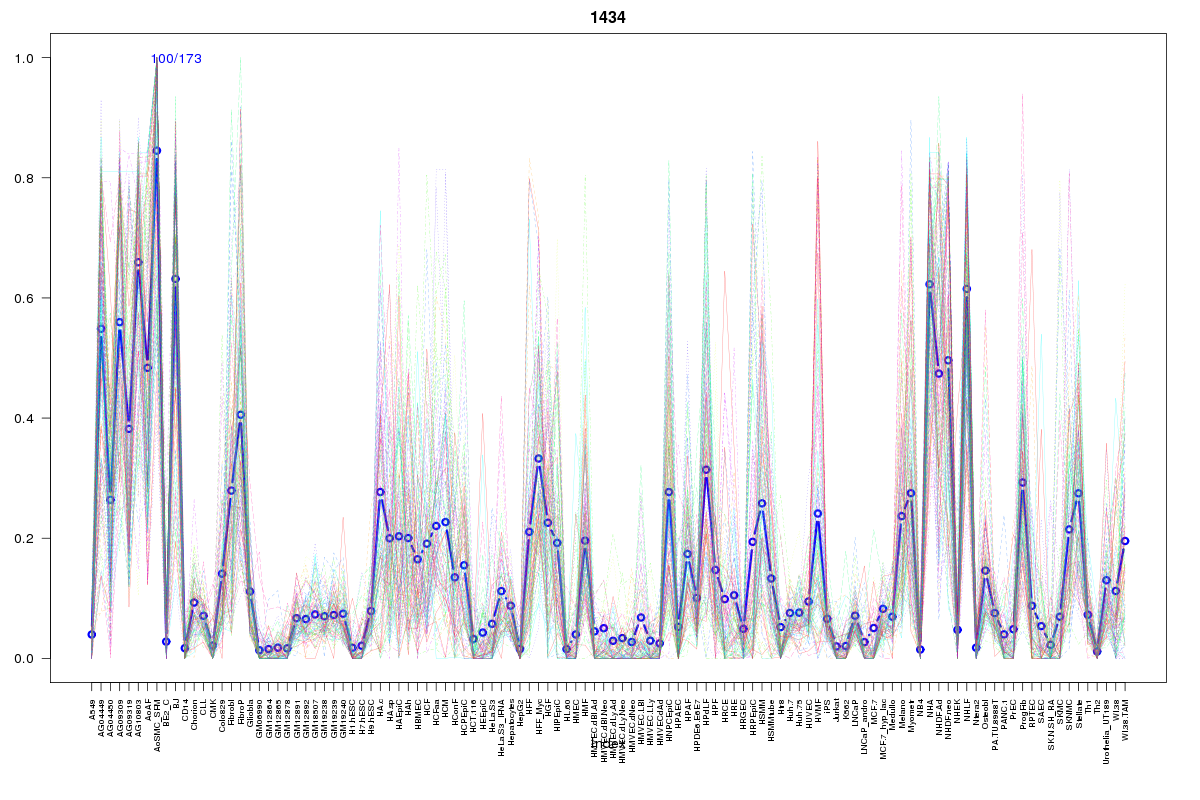 | 1434 | 1 |
 | 935 | 1 |
 | 230 | 1 |
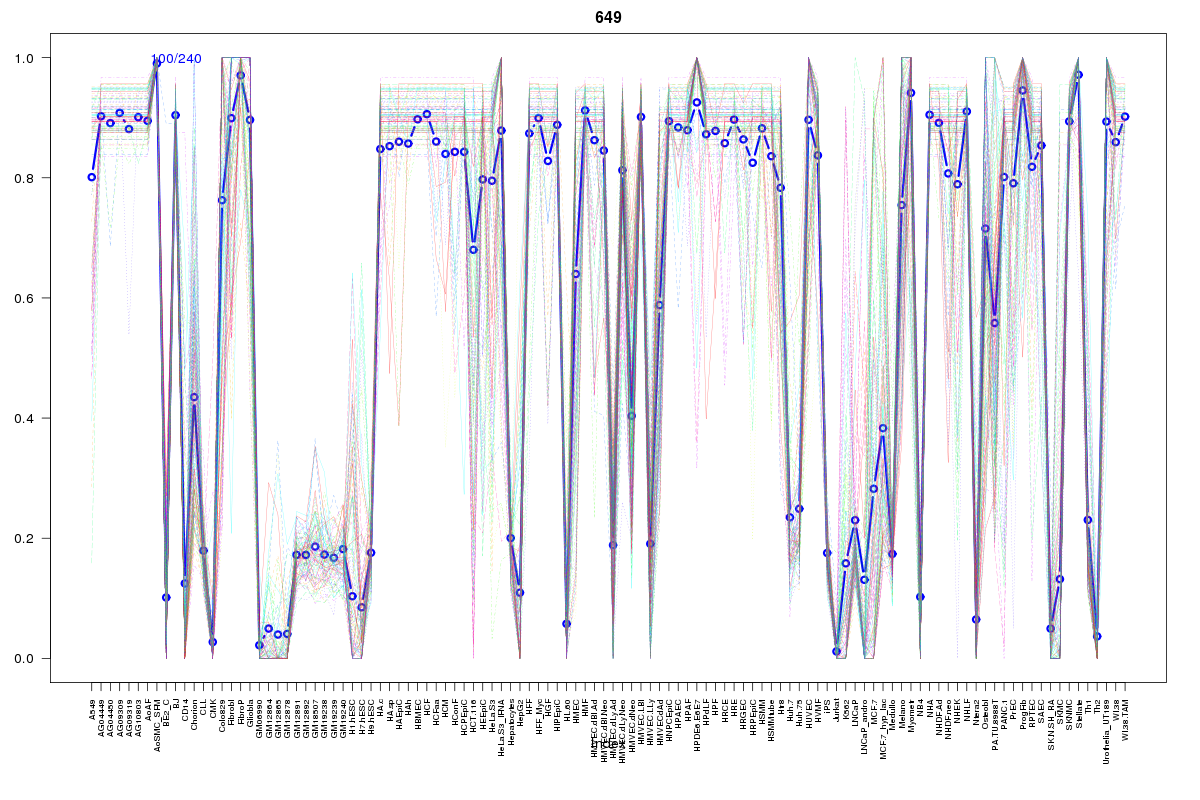 | 649 | 1 |
 | 1075 | 1 |
 | 66 | 1 |
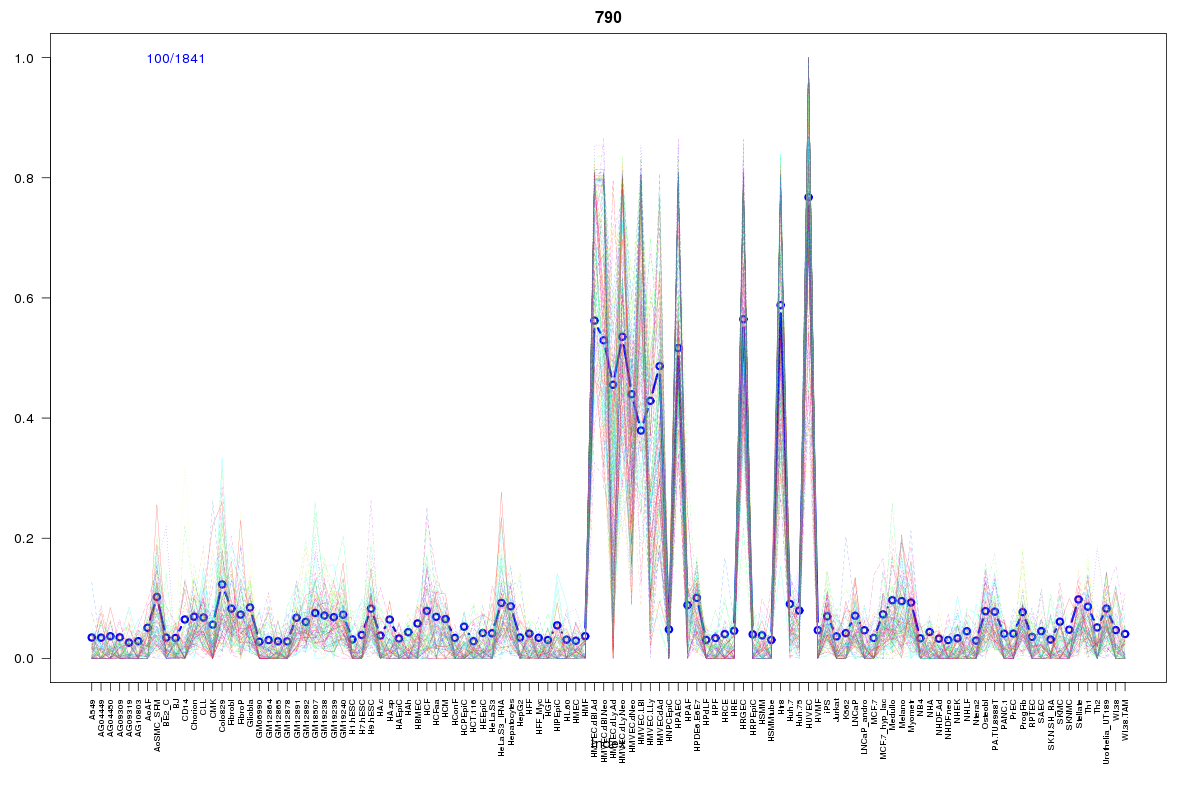 | 790 | 1 |
 | 2107 | 1 |
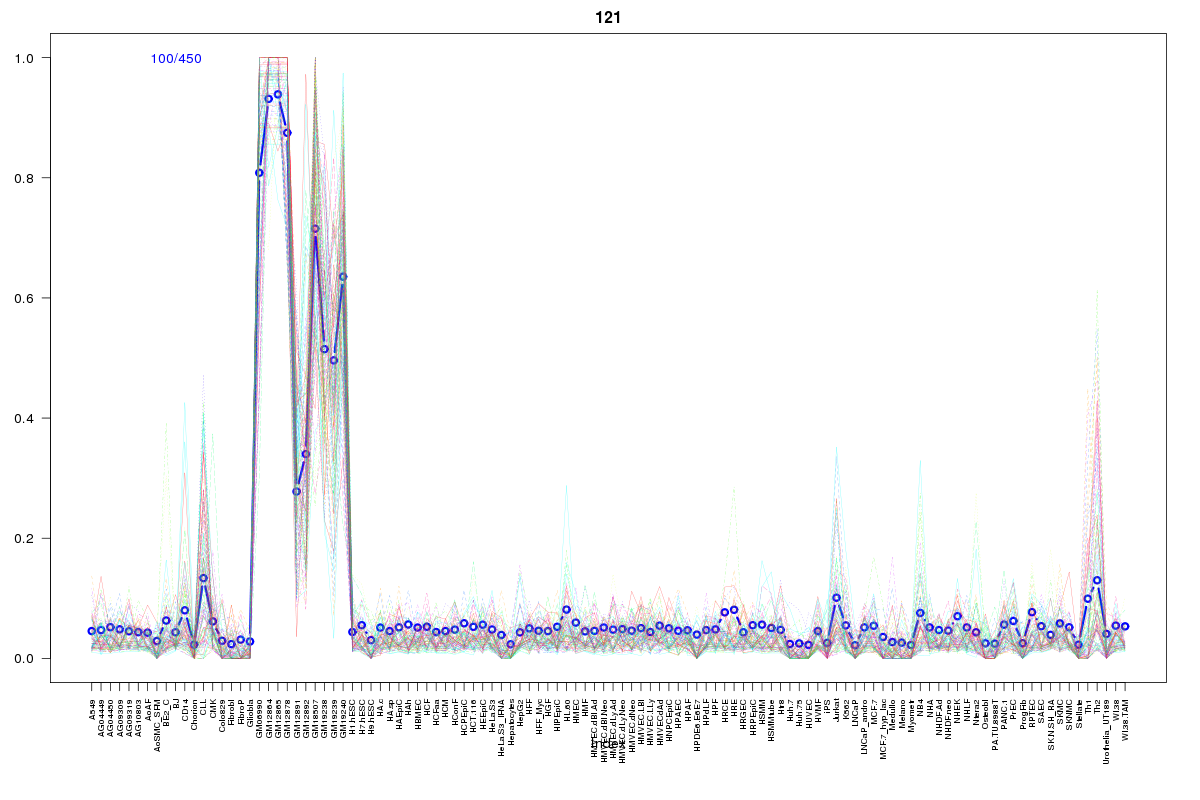 | 121 | 1 |
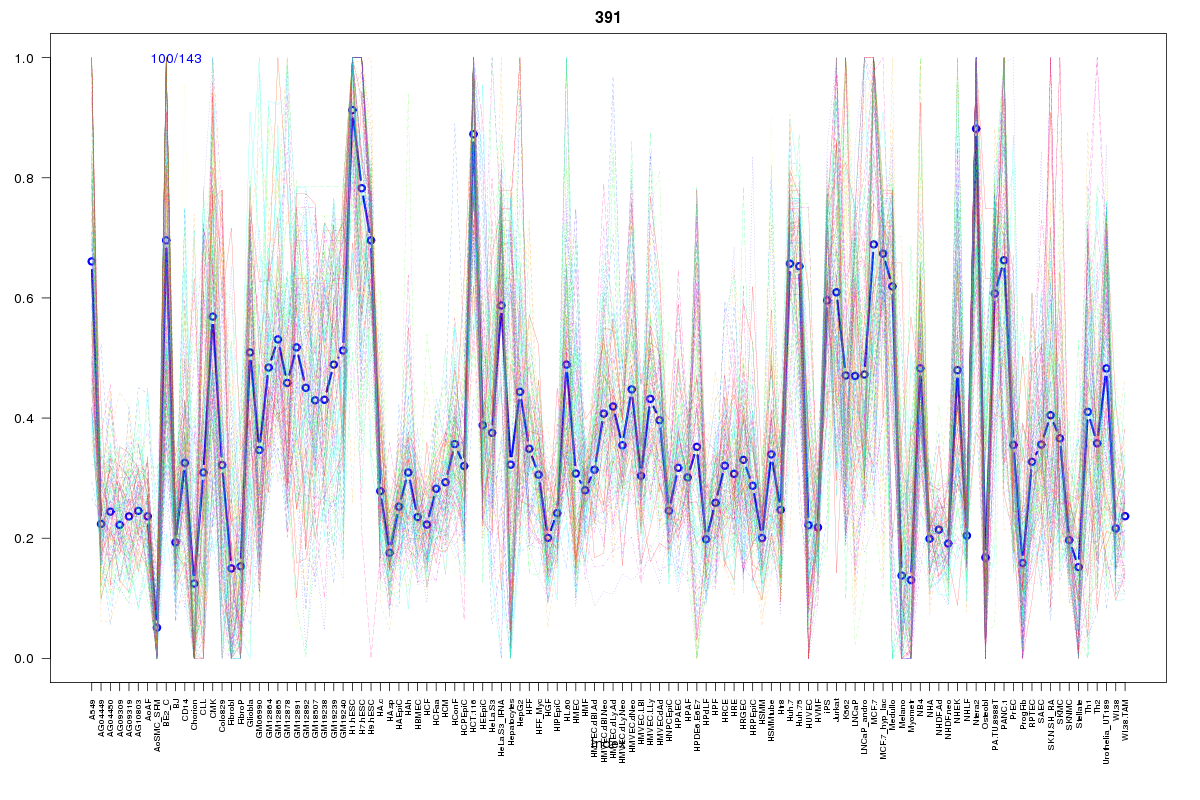 | 391 | 1 |
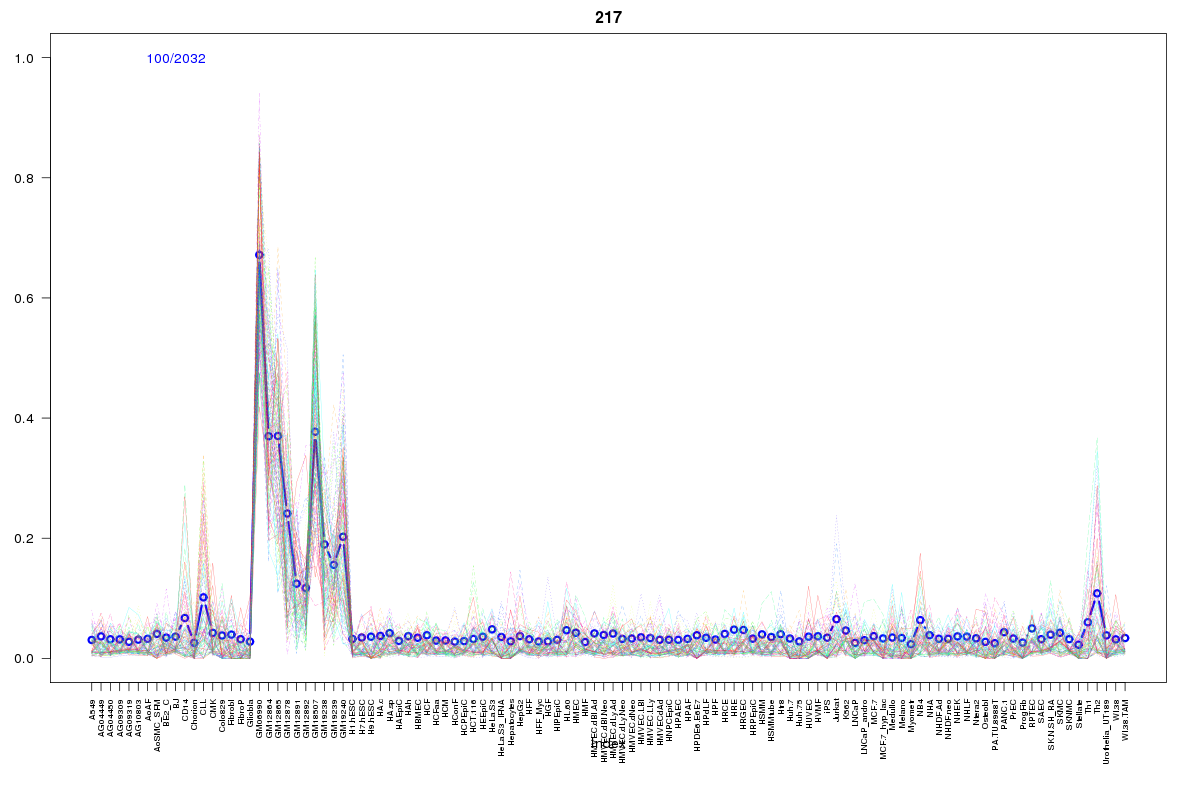 | 217 | 1 |
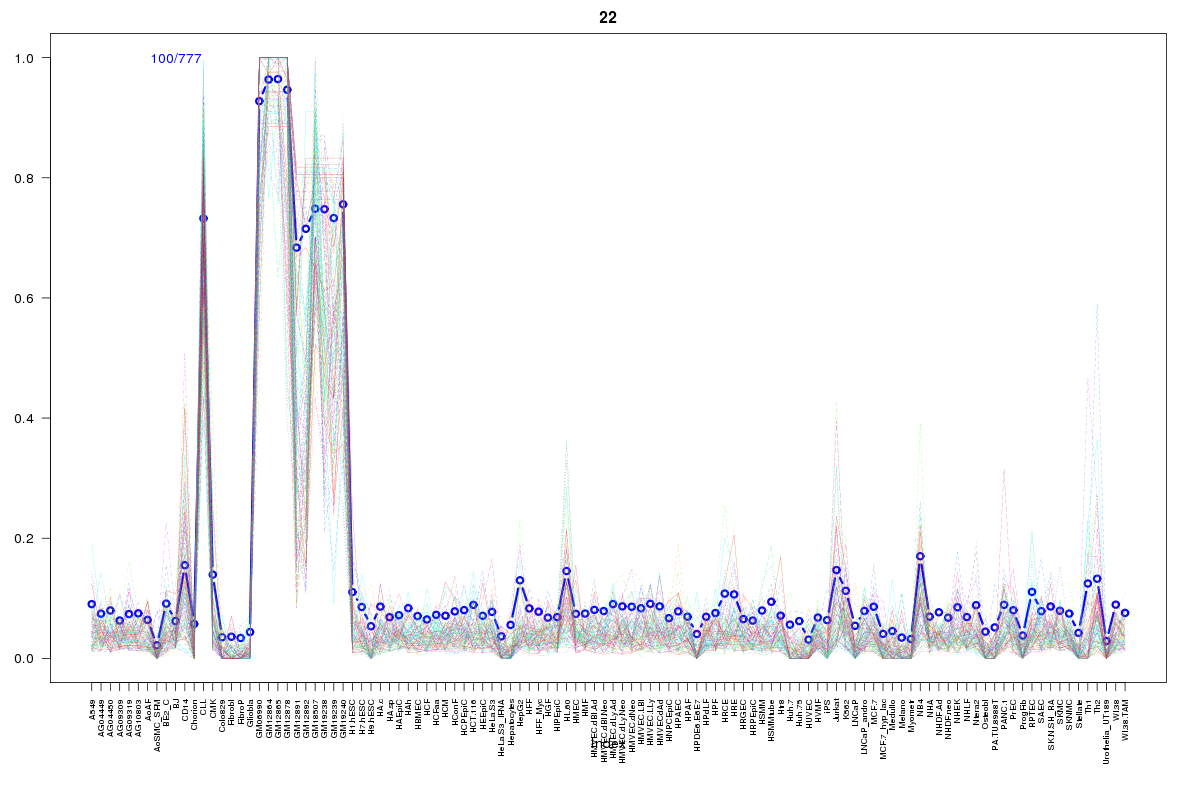 | 22 | 1 |
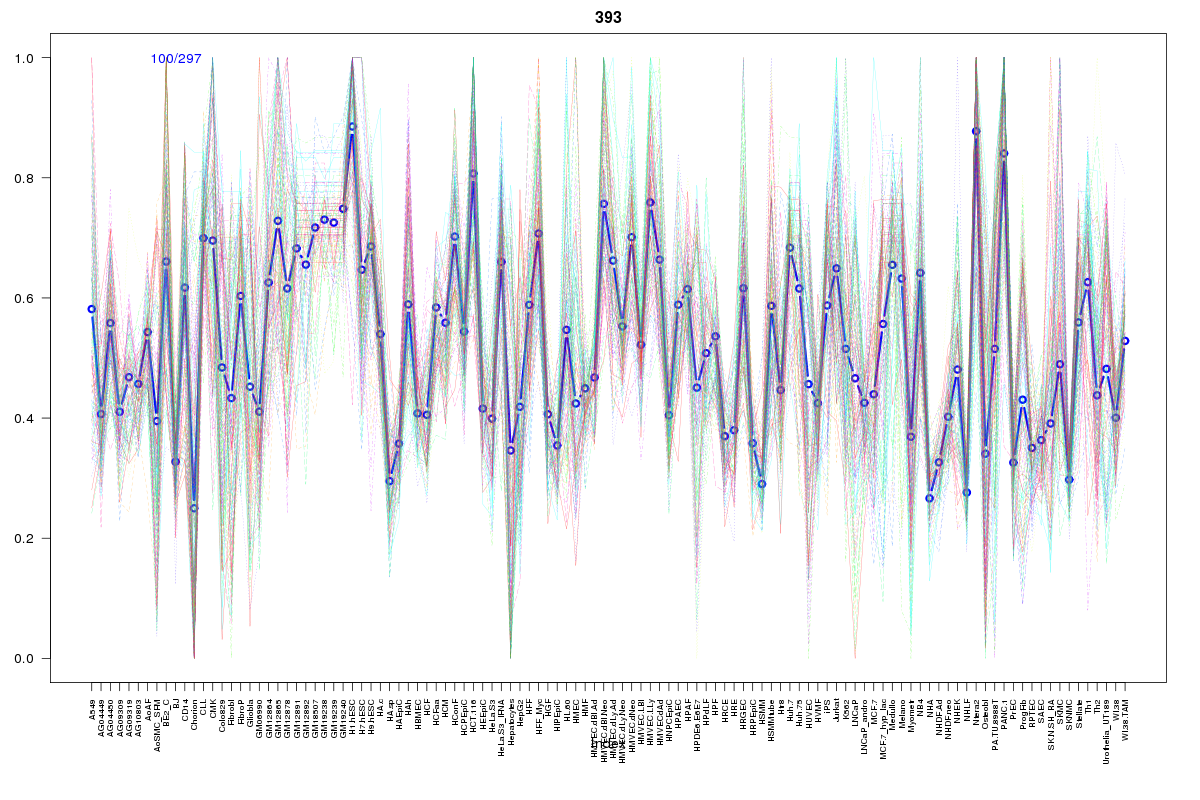 | 393 | 1 |
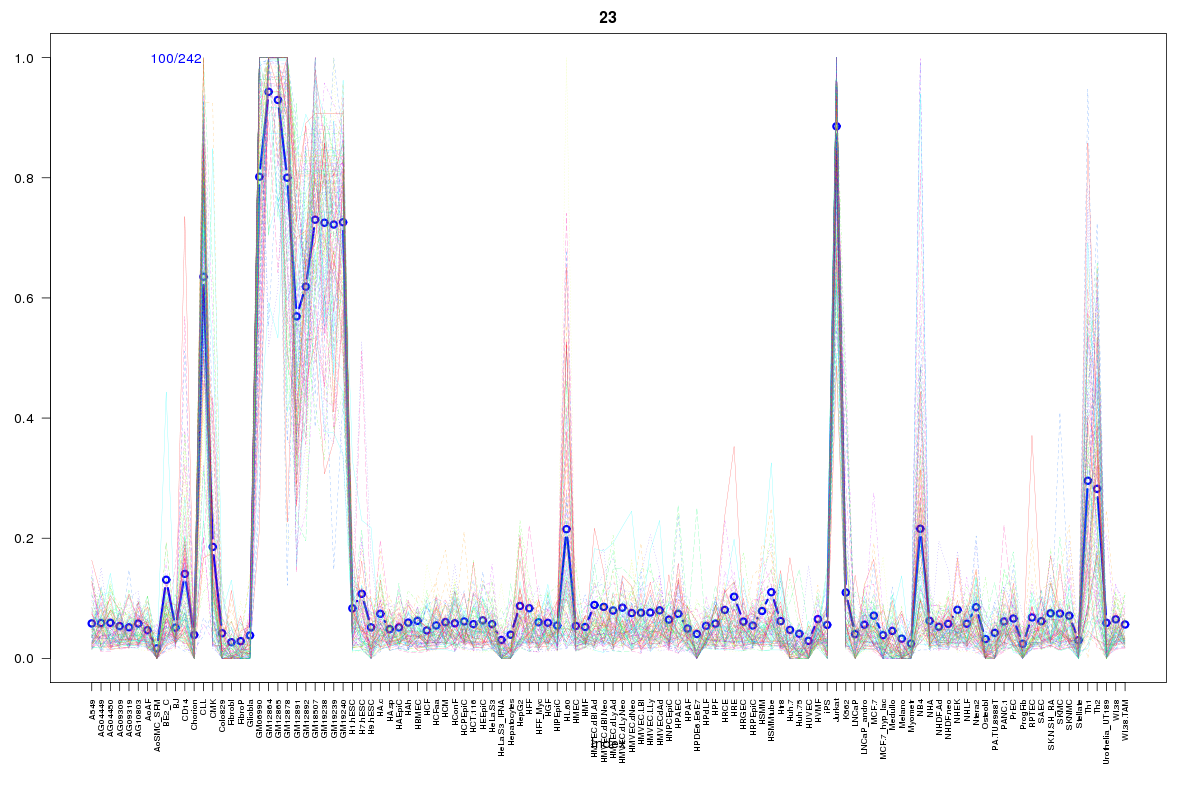 | 23 | 1 |
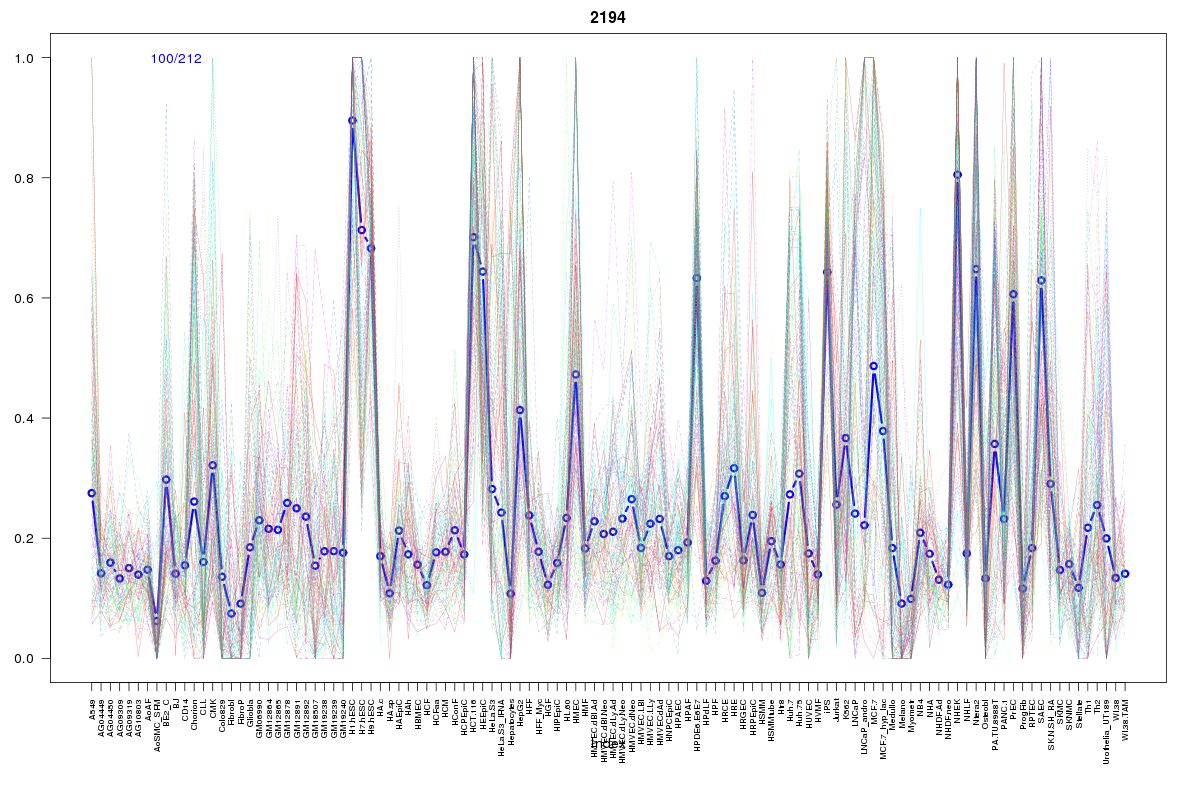 | 2194 | 1 |
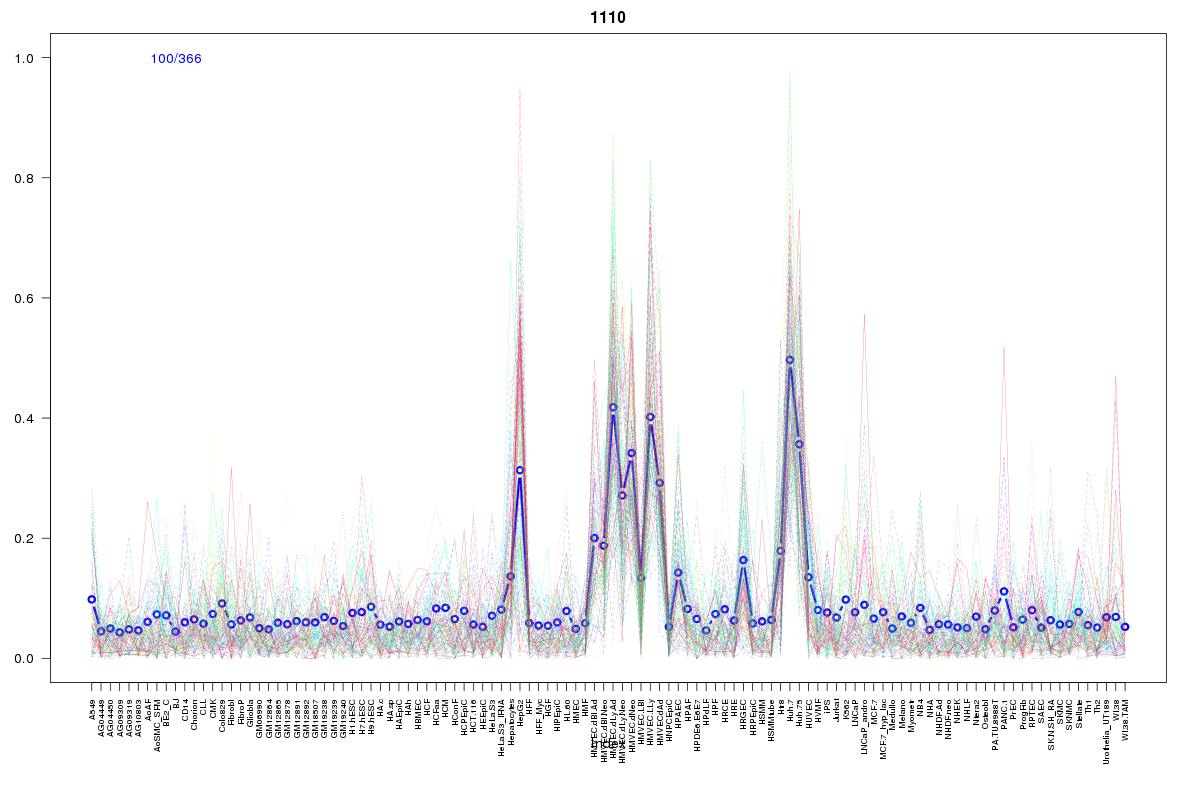 | 1110 | 1 |
 | 20 | 1 |
Resources
BED file downloads
Connects to 51 DHS sitesTop 10 Correlated DHS Sites
p-values indiciate significant higher or lower correlation| Location | Cluster | P-value |
|---|---|---|
| chr1:204463140-204463290 | 442 | 0 |
| chr1:204367700-204367850 | 394 | 0 |
| chr1:204430860-204431010 | 77 | 0.001 |
| chr1:204422380-204422530 | 637 | 0.001 |
| chr1:204430560-204430710 | 2268 | 0.001 |
| chr1:204463960-204464110 | 132 | 0.003 |
| chr1:204415700-204415850 | 393 | 0.004 |
| chr1:204430385-204430535 | 2011 | 0.005 |
| chr1:204431220-204431370 | 1179 | 0.006 |
| chr1:204535040-204535190 | 394 | 0.006 |
| chr1:204464185-204464335 | 661 | 0.006 |
External Databases
UCSCEnsembl (ENSG00000133056)