SOM cluster: 372
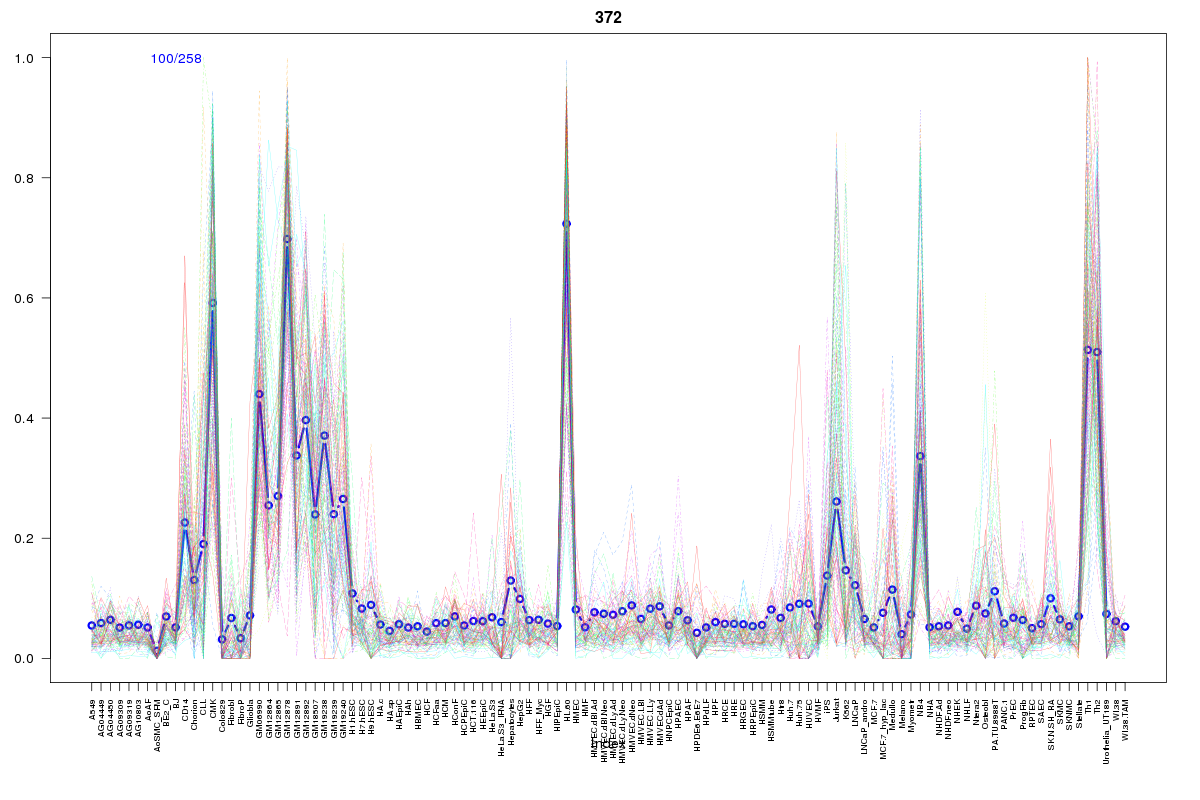
Cluster Hypersensitivity Profile

Genomic Location Trend
These plots show the distribution of the DHS sites surrounding the Transcript Start Site of the nearest gene.
Stats
Number of sites: 258Promoter: 21%
CpG-Island: 7%
Conserved: 40%
Enriched Motifs & Matches
Match Detail: [Jaspar]
|
| ||
|---|---|---|
| Sites: 89/100 | e-val: 0 | ||
| Factor | e-val(match) | DB |
| SP1 | 0.0000036664 | JASPAR |
| EWSR1-FLI1 | 0.000008662 | JASPAR |
| Pax4 | 0.00001399 | JASPAR |
| RREB1 | 0.0003664 | JASPAR |
| INSM1 | 0.0004966 | JASPAR |
|
| ||
| Sites: 58/100 | e-val: 2.5e-20 | ||
| Factor | e-val(match) | DB |
| PLAG1 | 0.000053046 | JASPAR |
| SP1 | 0.00021642 | JASPAR |
| Tal1::Gata1 | 0.0068437 | JASPAR |
| RXR::RAR_DR5 | 0.018144 | JASPAR |
| INSM1 | 0.021243 | JASPAR |
|
| ||
| Sites: 24/100 | e-val: 0.00000048 | ||
| Factor | e-val(match) | DB |
| TP53 | 0.0030527 | JASPAR |
| SP1 | 0.003492 | JASPAR |
| Klf4 | 0.0042582 | JASPAR |
| REST | 0.012378 | JASPAR |
| Zfx | 0.021293 | JASPAR |
|
| ||
| Sites: 30/100 | e-val: 0.0012 | ||
| Factor | e-val(match) | DB |
| INSM1 | 0.00000089558 | JASPAR |
| TFAP2A | 0.0000042647 | JASPAR |
| EBF1 | 0.000010982 | JASPAR |
| REST | 0.0005106 | JASPAR |
| PLAG1 | 0.00062943 | JASPAR |
BED file downloads
Top 10 Example Regions
| Location | Gene Link | Dist. |
|---|---|---|
| chr1: 151129680-151129830 | SEMA6C | 13.44 |
| chr1: 151129680-151129830 | PSMD4 | 13.44 |
| chr1: 151129680-151129830 | TNFAIP8L2 | 13.44 |
| chr1: 151129680-151129830 | SCNM1 | 13.44 |
| chr1: 203256845-203256995 | NPM1P40 | 34.69 |
| chr1: 203256845-203256995 | RP11-134P9.3 | 34.69 |
| chr1: 167597180-167597330 | RCSD1 | 39.39 |
| chr1: 167597180-167597330 | RP3-455J7.4 | 39.39 |
| chr1: 167597180-167597330 | MPZL1 | 39.39 |
| chr3: 39190120-39190270 | GORASP1 | 41.43 |