SOM cluster: 422
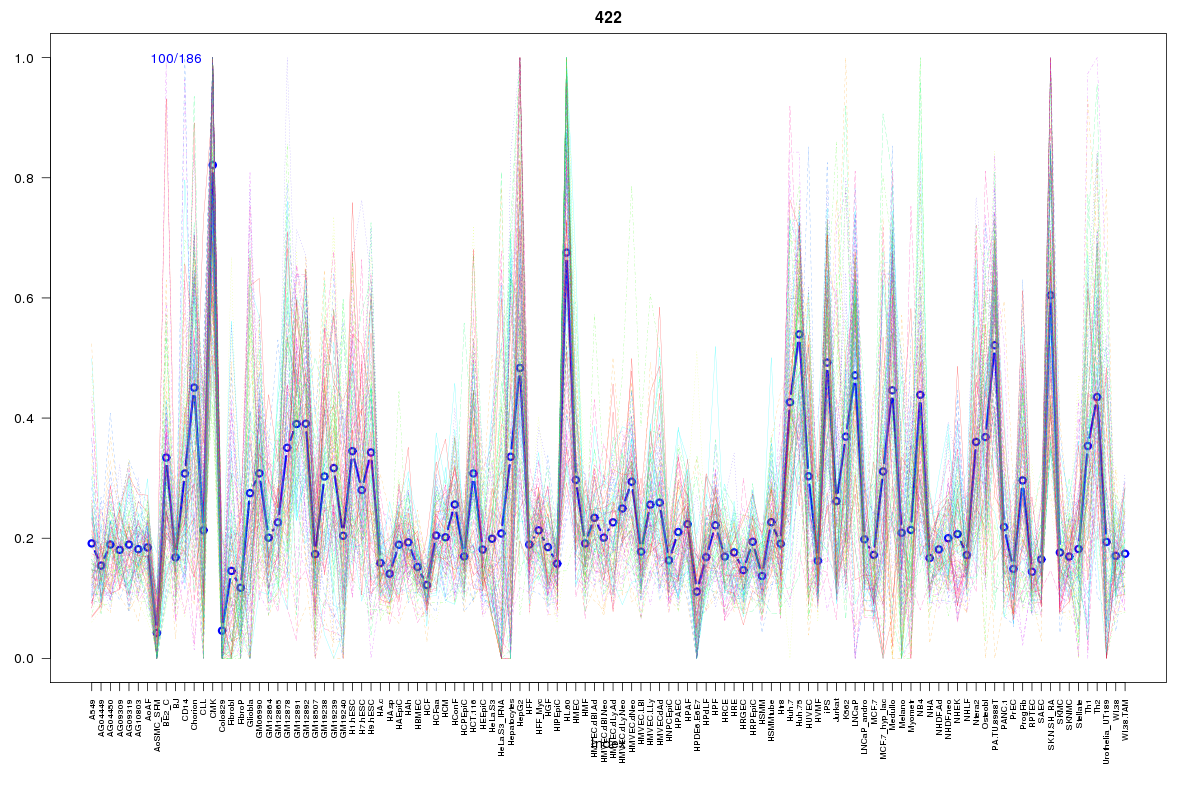
Cluster Hypersensitivity Profile

Genomic Location Trend
These plots show the distribution of the DHS sites surrounding the Transcript Start Site of the nearest gene.
Stats
Number of sites: 186Promoter: 40%
CpG-Island: 73%
Conserved: 60%
Enriched Motifs & Matches
Match Detail: [Jaspar]
|
| ||
|---|---|---|
| Sites: 92/100 | e-val: 0 | ||
| Factor | e-val(match) | DB |
| SP1 | 0.000000038364 | JASPAR |
| Egr1 | 0.0026579 | JASPAR |
| TFAP2A | 0.0072082 | JASPAR |
| PLAG1 | 0.007671 | JASPAR |
| Pax4 | 0.013953 | JASPAR |
|
| ||
| Sites: 71/100 | e-val: 2.4e-17 | ||
| Factor | e-val(match) | DB |
| SP1 | 0.00000056247 | JASPAR |
| Tal1::Gata1 | 0.0011884 | JASPAR |
| TFAP2A | 0.0011887 | JASPAR |
| PLAG1 | 0.0014773 | JASPAR |
| EWSR1-FLI1 | 0.0014832 | JASPAR |
BED file downloads
Top 10 Example Regions
| Location | Gene Link | Dist. |
|---|---|---|
| chr7: 151574620-151574770 | PRKAG2-AS1 | 47.68 |
| chr16: 88753200-88753350 | SNAI3 | 53.92 |
| chr11: 64510700-64510850 | RASGRP2 | 55.18 |
| chr11: 64510700-64510850 | MAP4K2 | 55.18 |
| chr19: 34288120-34288270 | KCTD15 | 55.63 |
| chr6: 39196920-39197070 | KCNK5 | 56.06 |
| chr19: 10812480-10812630 | SLC44A2 | 57.71 |
| chr19: 10812480-10812630 | QTRT1 | 57.71 |
| chr9: 131465440-131465590 | ZER1 | 58.29 |
| chr9: 131465440-131465590 | PKN3 | 58.29 |